Answered step by step
Verified Expert Solution
Question
1 Approved Answer
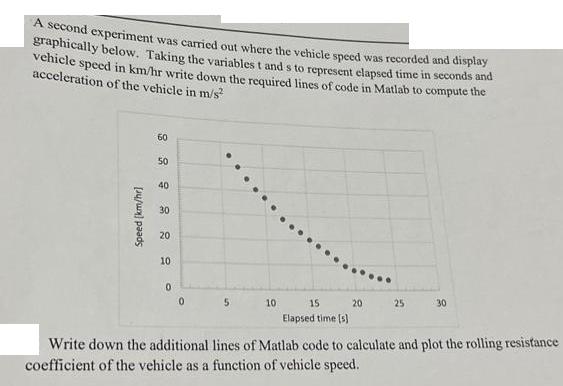
A second experiment was carried out where the vehicle speed was recorded and display graphically below. Taking the variables t and s to represent

A second experiment was carried out where the vehicle speed was recorded and display graphically below. Taking the variables t and s to represent elapsed time in seconds and vehicle speed in km/hr write down the required lines of code in Matlab to compute the acceleration of the vehicle in m/s Speed [km/hr] 60 50 40 30 20 10 0 0 5 10 15 Elapsed time [s] 20 25 30 Write down the additional lines of Matlab code to calculate and plot the rolling resistance coefficient of the vehicle as a function of vehicle speed. A second experiment was carried out where the vehicle speed was recorded and display graphically below. Taking the variables t and s to represent elapsed time in seconds and vehicle speed in km/hr write down the required lines of code in Matlab to compute the acceleration of the vehicle in m/s Speed [km/hr] 60 50 40 30 20 10 0 0 5 10 15 Elapsed time [s] 20 25 30 Write down the additional lines of Matlab code to calculate and plot the rolling resistance coefficient of the vehicle as a function of vehicle speed.
Step by Step Solution
There are 3 Steps involved in it
Step: 1
Certainly Here are the lines of code you can use in MATLAB to compute the acceleration of the vehicl...
Get Instant Access to Expert-Tailored Solutions
See step-by-step solutions with expert insights and AI powered tools for academic success
Step: 2

Step: 3

Ace Your Homework with AI
Get the answers you need in no time with our AI-driven, step-by-step assistance
Get Started


