Answered step by step
Verified Expert Solution
Question
1 Approved Answer
a. Select cell A4 on the Stats worksheet. Format the data as an Excel table using Green, Table Style Medium 21. b. Copy the Stats


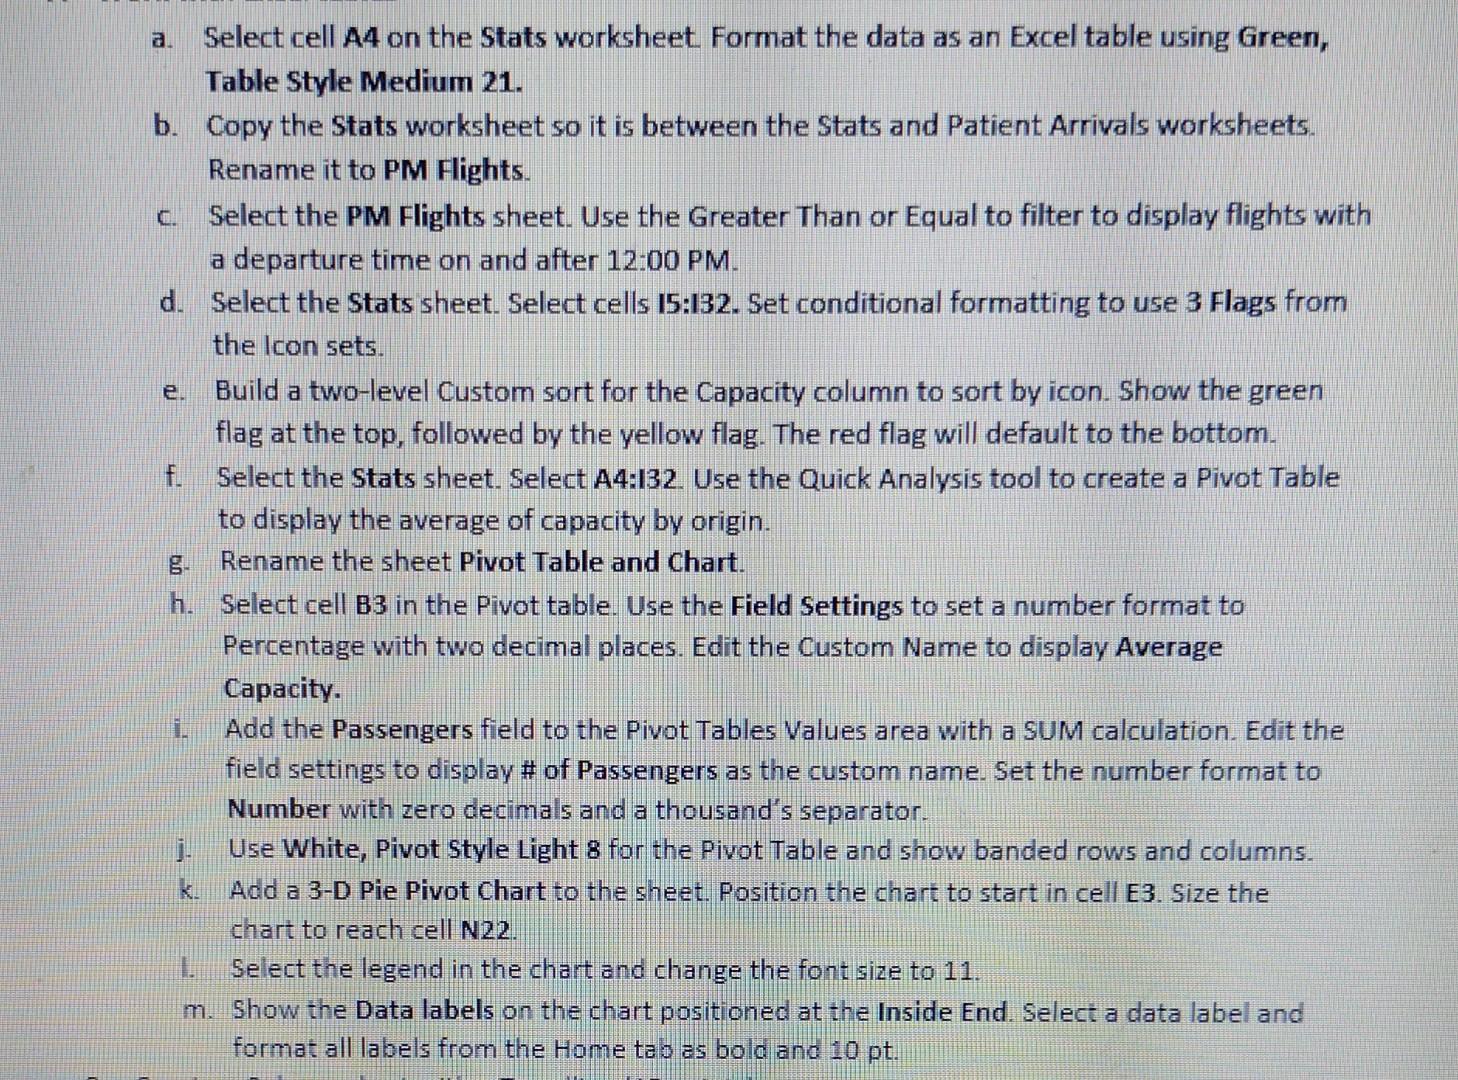
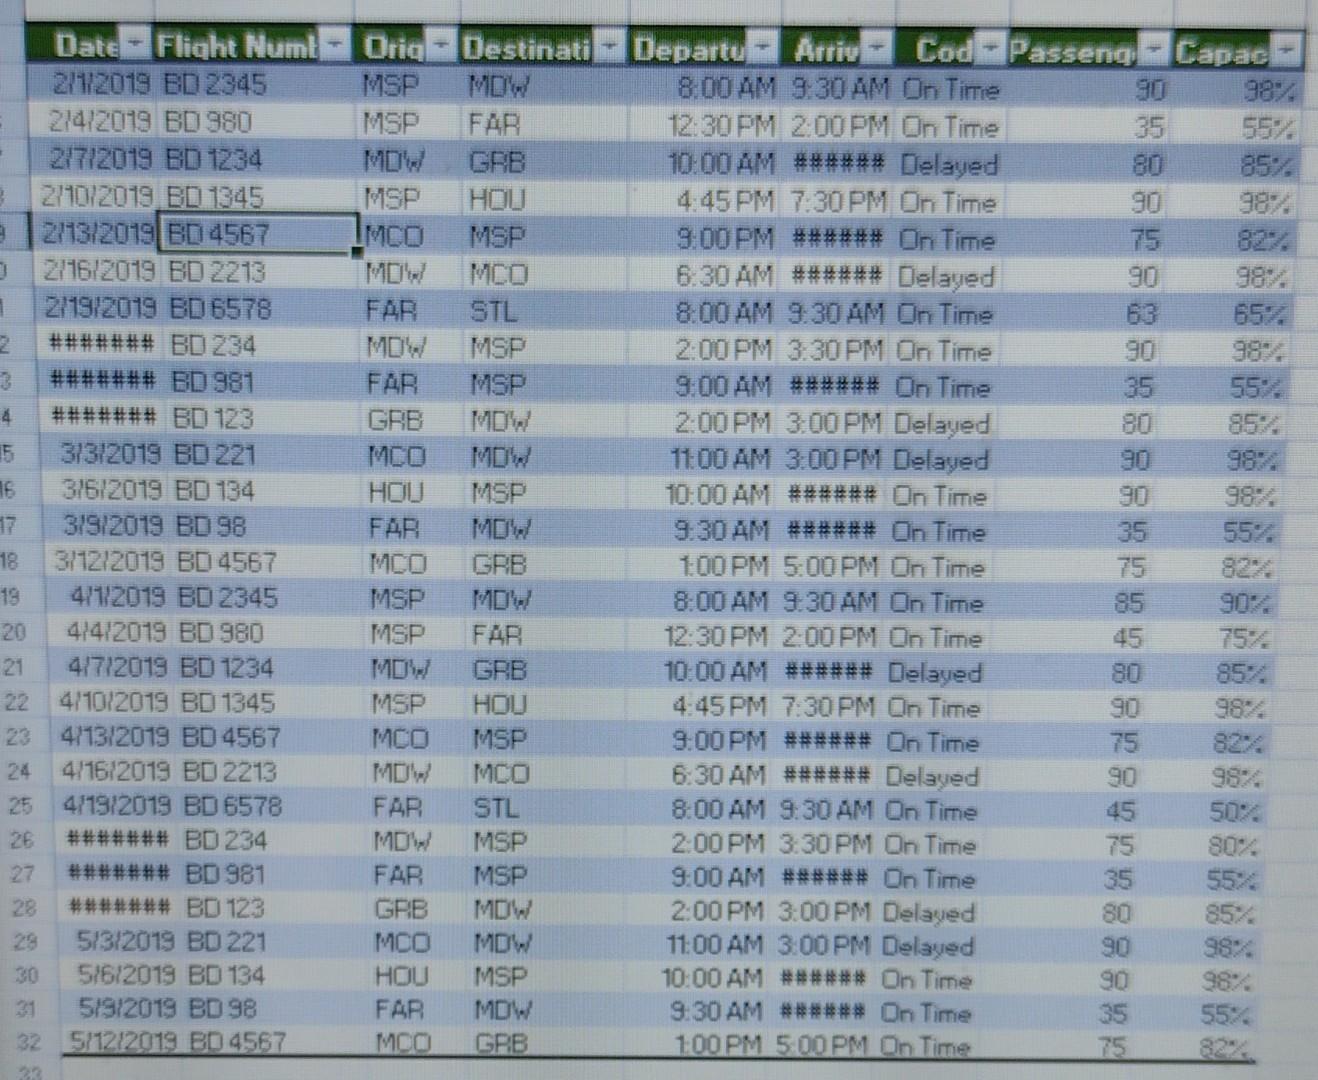
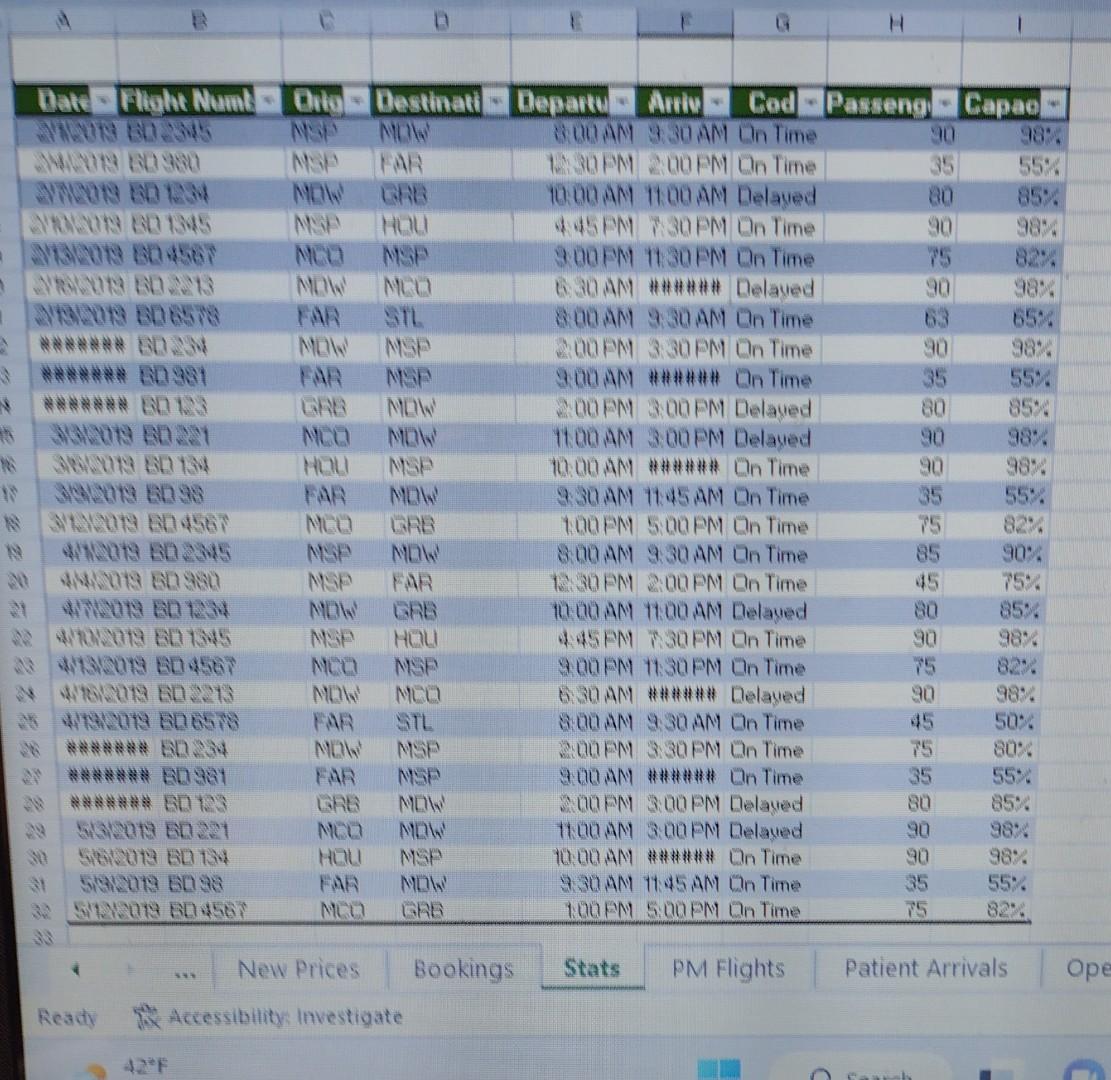
a. Select cell A4 on the Stats worksheet. Format the data as an Excel table using Green, Table Style Medium 21. b. Copy the Stats worksheet so it is between the Stats and Patient Arrivals worksheets. Rename it to PM Flights. c. Select the PM Flights sheet. Use the Greater Than or Equal to filter to display flights with a departure time on and after 12:00 PM. d. Select the Stats sheet. Select cells I5:132. Set conditional formatting to use 3 Flags from the Icon sets. e. Build a two-level Custom sort for the Capacity column to sort by icon. Show the green flag at the top, followed by the yellow flag. The red flag will default to the bottom. f. Select the Stats sheet. Select A4:132. Use the Quick Analysis tool to create a Pivot Table to display the average of capacity by origin. g. Rename the sheet Pivot Table and Chart. h. Select cell B3 in the Pivot table. Use the Field Settings to set a number format to Percentage with two decimal places. Edit the Custom Name to display Average Capacity. i. Add the Passengers field to the Pivot Tables Values area with a SUM calculation. Edit the field settings to display \# of Passengers as the custom name. Set the number format to Number with zero decimals and a thousand's separator. j. Use White, Pivot Style Light 8 for the Pivot Table and show banded rows and columns. k. Add a 3-D Pie Pivot Chart to the sheet. Position the chart to start in cell E3. Size the chart to reach cell N22. 1. Select the legend in the chart and change the font size to 11. m. Show the Data labels on the chart positioned at the Inside End. Select a data label and format all labels from the Home tab as bold and 10pt. 33
Step by Step Solution
There are 3 Steps involved in it
Step: 1

Get Instant Access to Expert-Tailored Solutions
See step-by-step solutions with expert insights and AI powered tools for academic success
Step: 2

Step: 3

Ace Your Homework with AI
Get the answers you need in no time with our AI-driven, step-by-step assistance
Get Started


