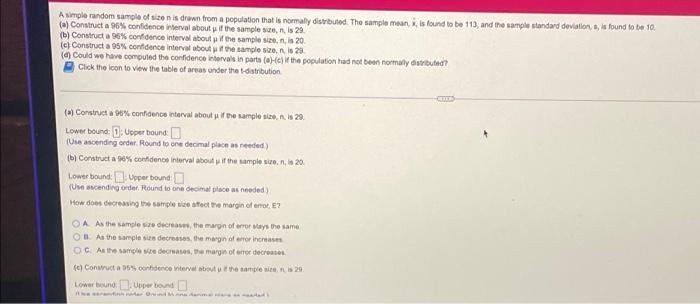
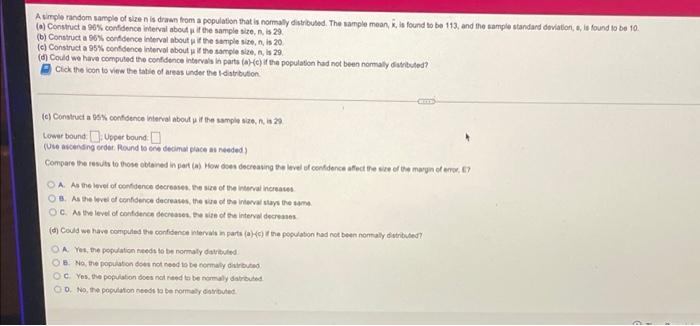
A simple random sample of size is drawn from a population that is normally distributed. The sample mean, is found to be 113 and the sample standard deviations, is found to be 10. (a) Construct a 96% confidence interval about if the sample sens 29 (b) Construct a 96% confidence interval about if the sample size, na 20 (c) Construct a 95% confidence interval about the sample size is 29 (Could we have computed the confidence intervals in parts (He) if the population had not been normal distributed? Click the icon to view the table of areas under the distribution Construct a 90% confidence interval about if he sample size, a 20 Lower bound: DUpper bound (Use ascending order Round to one decimal places needed) (b) Construct a 96% confidence interval about if the sample size, 11, 120 Lower bound: :Upper bound U scending order. Round to one omal place as needed) How does decreasing the sample set the margin of error ? OA As the same see the margin of error ways the same O At the sample sa decresses the margin of increases OCAs the sample wederases, the margin of error decreases (c) Constructa 165 cendence interval of the samples 29 Lower bound Uppertondo A simple random sample of size nis drawn from a population that is normally distributed. The sample mean, i la found to be 113, and the sample standard deviation, a, is found to be 10. (a) Construct a 90% confidence interval about the sample size is 29 (b) Construct a 90% confidence interval about if the sample size is 20 (c) Construct a 95% confidence interval about the sample size, ls 29 (al could we have computed the confidence intervals in parts (He) i ne population had not been nomaly ribsted? Click the icon to view the table of areas under the distribution (c) Construct a 16% confidence interval about the sample size #23 Lower bound: :Upper bound Une sounding order. Round to one decimal place as needed Compare the results to those obtained in part(s) How to decreasing the level of contdenca efecte of the maryn of error, 67 OA As the level of confidence decrease the size of the interval races OB. As the level of confidence decreases the wore of the interval stays the same OC. As the level of confidence decreases the law of the interval decretos (c) Cod we have computed the confidence intervis in parts (Kothe population had not been normally distributed OA Yes, the population needs to be normaly davituled O No, the population does not need to be normally OG Yes, the population does noted to be normal dared 0. No, the populations to be romaly darbus A simple random sample of size is drawn from a population that is normally distributed. The sample mean, is found to be 113 and the sample standard deviations, is found to be 10. (a) Construct a 96% confidence interval about if the sample sens 29 (b) Construct a 96% confidence interval about if the sample size, na 20 (c) Construct a 95% confidence interval about the sample size is 29 (Could we have computed the confidence intervals in parts (He) if the population had not been normal distributed? Click the icon to view the table of areas under the distribution Construct a 90% confidence interval about if he sample size, a 20 Lower bound: DUpper bound (Use ascending order Round to one decimal places needed) (b) Construct a 96% confidence interval about if the sample size, 11, 120 Lower bound: :Upper bound U scending order. Round to one omal place as needed) How does decreasing the sample set the margin of error ? OA As the same see the margin of error ways the same O At the sample sa decresses the margin of increases OCAs the sample wederases, the margin of error decreases (c) Constructa 165 cendence interval of the samples 29 Lower bound Uppertondo A simple random sample of size nis drawn from a population that is normally distributed. The sample mean, i la found to be 113, and the sample standard deviation, a, is found to be 10. (a) Construct a 90% confidence interval about the sample size is 29 (b) Construct a 90% confidence interval about if the sample size is 20 (c) Construct a 95% confidence interval about the sample size, ls 29 (al could we have computed the confidence intervals in parts (He) i ne population had not been nomaly ribsted? Click the icon to view the table of areas under the distribution (c) Construct a 16% confidence interval about the sample size #23 Lower bound: :Upper bound Une sounding order. Round to one decimal place as needed Compare the results to those obtained in part(s) How to decreasing the level of contdenca efecte of the maryn of error, 67 OA As the level of confidence decrease the size of the interval races OB. As the level of confidence decreases the wore of the interval stays the same OC. As the level of confidence decreases the law of the interval decretos (c) Cod we have computed the confidence intervis in parts (Kothe population had not been normally distributed OA Yes, the population needs to be normaly davituled O No, the population does not need to be normally OG Yes, the population does noted to be normal dared 0. No, the populations to be romaly darbus