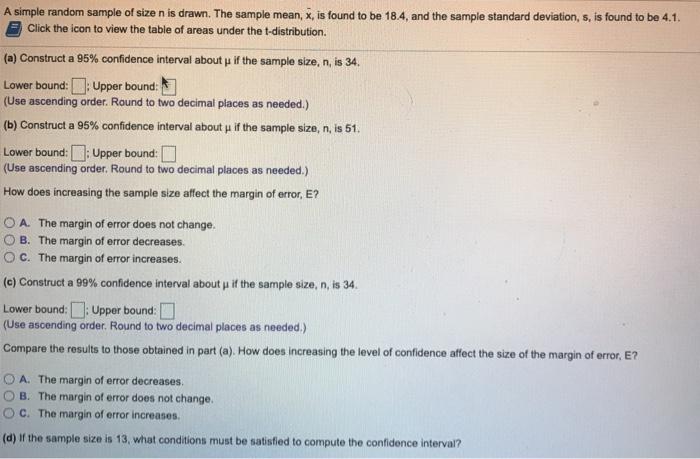
A simple random sample of size n is drawn. The sample mean, x, is found to be 18.4, and the sample standard deviation, s,


A simple random sample of size n is drawn. The sample mean, x, is found to be 18.4, and the sample standard deviation, s, is found to be 4.1. Click the icon to view the table of areas under the t-distribution. (a) Construct a 95% confidence interval about u if the sample size, n, is 34. Lower bound:: Upper bound: (Use ascending order. Round to two decimal places as needed.) (b) Construct a 95% confidence interval about u if the sample size, n, is 51. H Lower bound:: Upper bound: (Use ascending order. Round to two decimal places as needed.) How does increasing the sample size affect the margin of error, E? OA. The margin of error does not change. OB. The margin of error decreases. OC. The margin of error increases. (c) Construct a 99% confidence interval about u if the sample size, n, is 34. Lower bound:: Upper bound: (Use ascending order. Round to two decimal places as needed.) Compare the results to those obtained in part (a). How does increasing the level of confidence affect the size of the margin of error, E? OA. The margin of error decreases. OB. The margin of error does not change. C. The margin of error increases. (d) If the sample size is 13, what conditions must be satisfied to compute the confidence interval? (d) If the sample size is 13, what conditions must be satisfied to compute the confidence interval? A. The sample must come from a population that is normally distributed and the sample size must be large. B. The sample size must be large and the sample should not have any outliers. C. The sample data must come from a population that is normally distributed with no outliers.
Step by Step Solution
3.47 Rating (160 Votes )
There are 3 Steps involved in it
Step: 1
n 34 x 184 S 41 for 95 confidence level Zcritical Lower bound 17022 ...
See step-by-step solutions with expert insights and AI powered tools for academic success
Step: 2

Step: 3

Ace Your Homework with AI
Get the answers you need in no time with our AI-driven, step-by-step assistance
Get Started


