Answered step by step
Verified Expert Solution
Question
1 Approved Answer
A sinkhole is a natural depression in the ground that has no way for water to drain. Because the water can't drain well, it


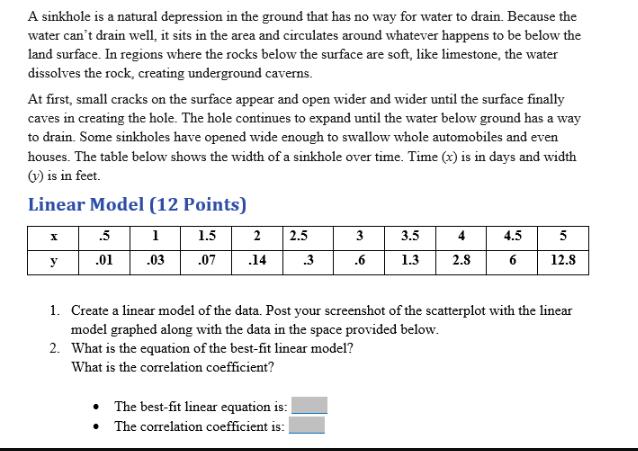
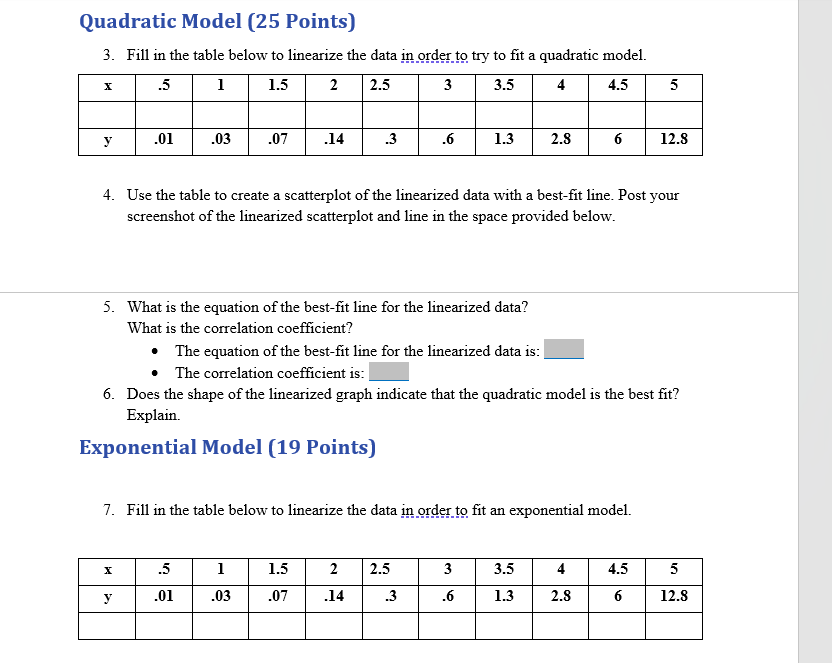
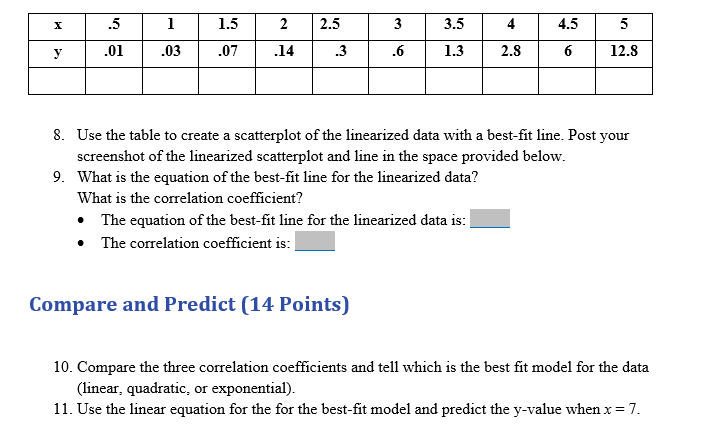
A sinkhole is a natural depression in the ground that has no way for water to drain. Because the water can't drain well, it sits in the area and circulates around whatever happens to be below the land surface. In regions where the rocks below the surface are soft, like limestone, the water dissolves the rock, creating underground caverns. At first, small cracks on the surface appear and open wider and wider until the surface finally caves in creating the hole. The hole continues to expand until the water below ground has a way to drain. Some sinkholes have opened wide enough to swallow whole automobiles and even houses. The table below shows the width of a sinkhole over time. Time (x) is in days and width (v) is in feet. Linear Model (12 Points) .5 1 1.5 2 2.5 3 3.5 4 4.5 5 y .01 .03 .07 .14 .3 .6 1.3 2.8 6 12.8 1. Create a linear model of the data. Post your screenshot of the scatterplot with the linear model graphed along with the data in the space provided below. 2. What is the equation of the best-fit linear model? What is the correlation coefficient? The best-fit linear equation is: The correlation coefficient is: Quadratic Model (25 Points) 3. Fill in the table below to linearize the data in order to try to fit a quadratic model. .5 1 1.5 2 2.5 3 3.5 4 4.5 5 y .01 .03 .07 .14 .3 .6 1.3 2.8 6 12.8 4. Use the table to create a scatterplot of the linearized data with a best-fit line. Post your screenshot of the linearized scatterplot and line in the space provided below. 5. What is the equation of the best-fit line for the linearized data? What is the correlation coefficient? The equation of the best-fit line for the linearized data is: The correlation coefficient is: 6. Does the shape of the linearized graph indicate that the quadratic model is the best fit? Explain. Exponential Model (19 Points) 7. Fill in the table below to linearize the data in order to fit an exponential model. x .5 1 1.5 2 2.5 3 3.5 4 4.5 5 y .01 .03 .07 .14 .3 .6 1.3 2.8 6 12.8 x .5 1 1.5 2 2.5 3 3.5 4 4.5 10 5 y .01 .03 .07 .14 .3 .6 1.3 2.8 6 12.8 8. Use the table to create a scatterplot of the linearized data with a best-fit line. Post your screenshot of the linearized scatterplot and line in the space provided below. 9. What is the equation of the best-fit line for the linearized data? What is the correlation coefficient? The equation of the best-fit line for the linearized data is: The correlation coefficient is: Compare and Predict (14 Points) 10. Compare the three correlation coefficients and tell which is the best fit model for the data (linear, quadratic, or exponential). 11. Use the linear equation for the for the best-fit model and predict the y-value when x = 7.
Step by Step Solution
There are 3 Steps involved in it
Step: 1

Get Instant Access to Expert-Tailored Solutions
See step-by-step solutions with expert insights and AI powered tools for academic success
Step: 2

Step: 3

Ace Your Homework with AI
Get the answers you need in no time with our AI-driven, step-by-step assistance
Get Started


