Answered step by step
Verified Expert Solution
Question
1 Approved Answer
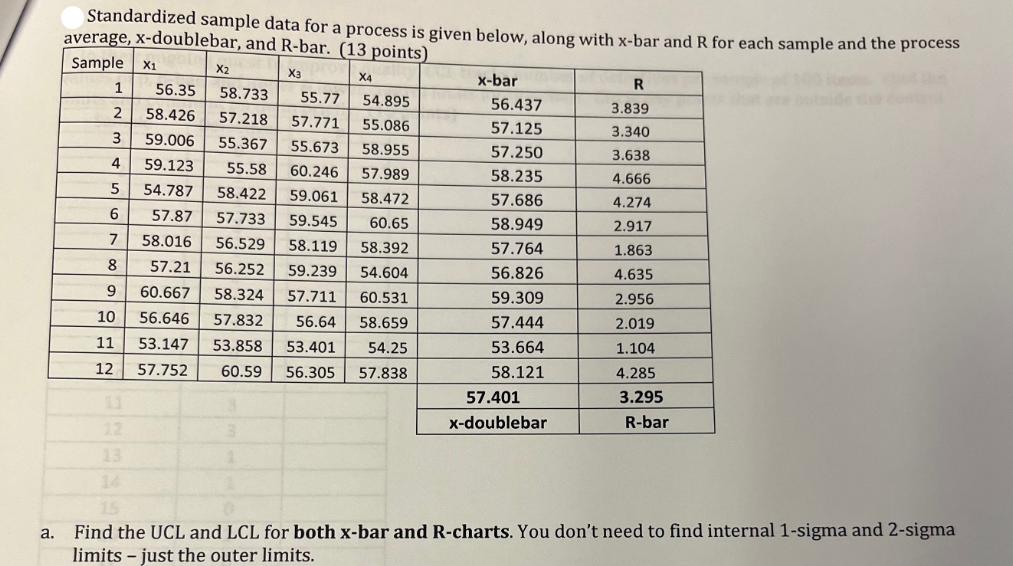
a. Standardized sample data for a process is given below, along with x-bar and R for each sample and the process average, x-doublebar, and


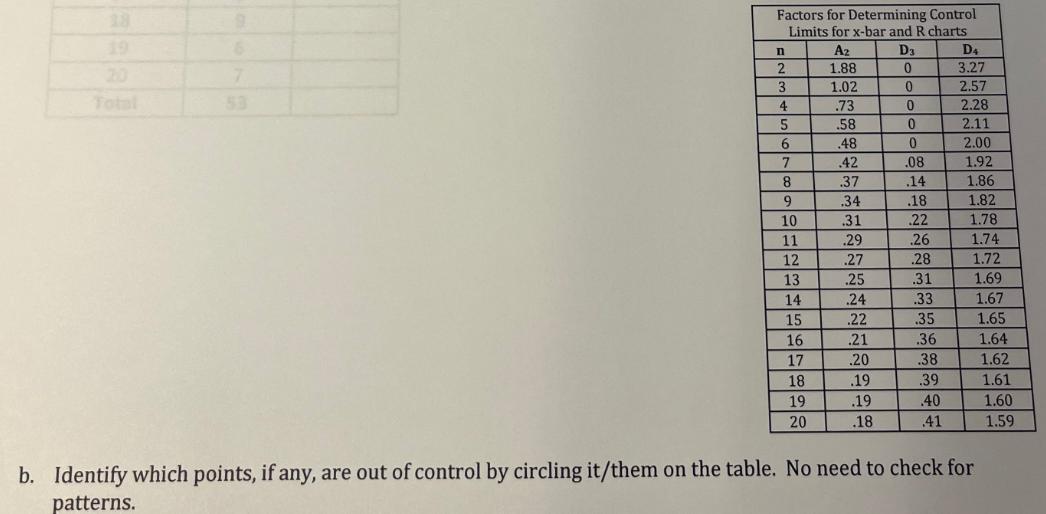
a. Standardized sample data for a process is given below, along with x-bar and R for each sample and the process average, x-doublebar, and R-bar. (13 points) Sample X1 X3 X2 13 14 X4 1 56.35 58.733 55.77 54.895 58.426 57.218 57.771 55.086 2 3 59.006 55.367 55.673 58.955 4 5 59.123 55.58 60.246 57.989 54.787 58.422 59.061 58.472 60.65 6 57.87 57.733 59.545 7 58.016 56.529 58.119 58.392 8 57.21 56.252 59.239 54.604 9 60.667 58.324 57.711 60.531 10 56.646 57.832 56.64 58.659 11 53.147 53.858 53.401 54.25 12 57.752 60.59 56.305 57.838 x-bar 56.437 57.125 57.250 58.235 57.686 58.949 57.764 56.826 59.309 57.444 53.664 58.121 57.401 x-doublebar R 3.839 3.340 3.638 4.666 4.274 2.917 1.863 4.635 2.956 2.019 1.104 4.285 3.295 R-bar Find the UCL and LCL for both x-bar and R-charts. You don't need to find internal 1-sigma and 2-sigma limits just the outer limits. 18 Total 9 6 7 Factors for Determining Control Limits for x-bar and R charts D3 0 n 2 3 4 5 6 7 8 9 10 11 12 13 14 15 16 17 18 19 20 Az 1.88 1.02 .73 .58 .48 .42 .37 .34 .31 .29 .27 25 .24 .22 .21 .20 .19 .19 .18 0 0 0 0 .08 .14 .18 .22 .26 28 .31 .33 .35 .36 .38 .39 .40 .41 D4 3.27 2.57 2.28 2.11 2.00 1.92 1.86 1.82 1.78 1.74 1.72 1.69 1.67 1.65 1.64 1.62 1.61 1.60 b. Identify which points, if any, are out of control by circling it/them on the table. No need to check for patterns. 1.59
Step by Step Solution
★★★★★
3.36 Rating (143 Votes )
There are 3 Steps involved in it
Step: 1
To find the Upper Control Limit UCL and Lower Control Limit LCL for both the xbar and R charts we ne...
Get Instant Access to Expert-Tailored Solutions
See step-by-step solutions with expert insights and AI powered tools for academic success
Step: 2

Step: 3

Ace Your Homework with AI
Get the answers you need in no time with our AI-driven, step-by-step assistance
Get Started


