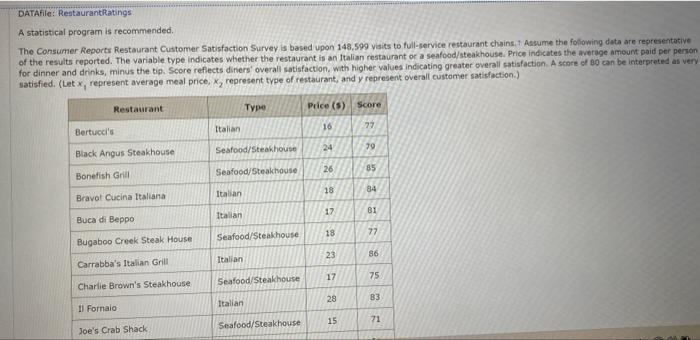
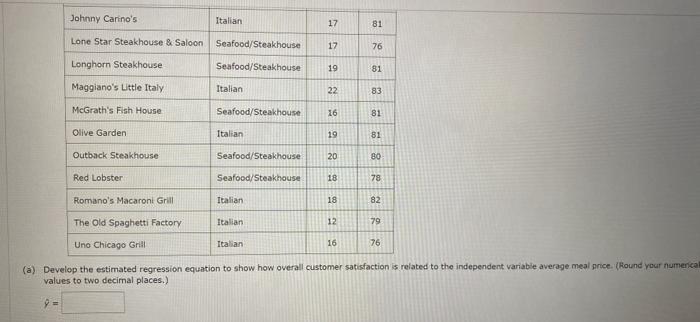
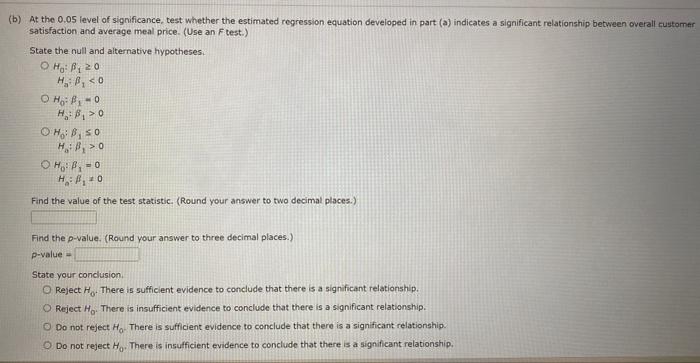
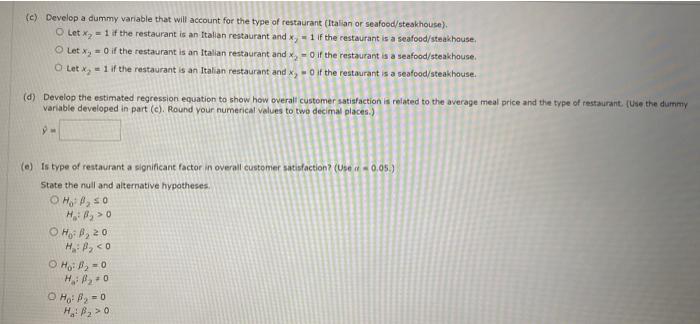
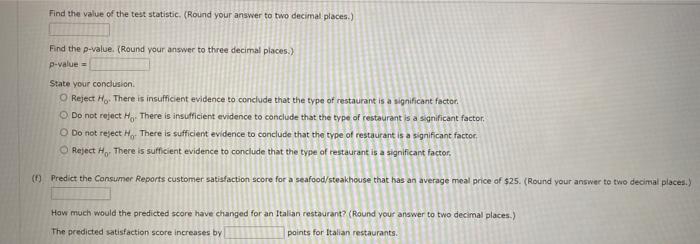
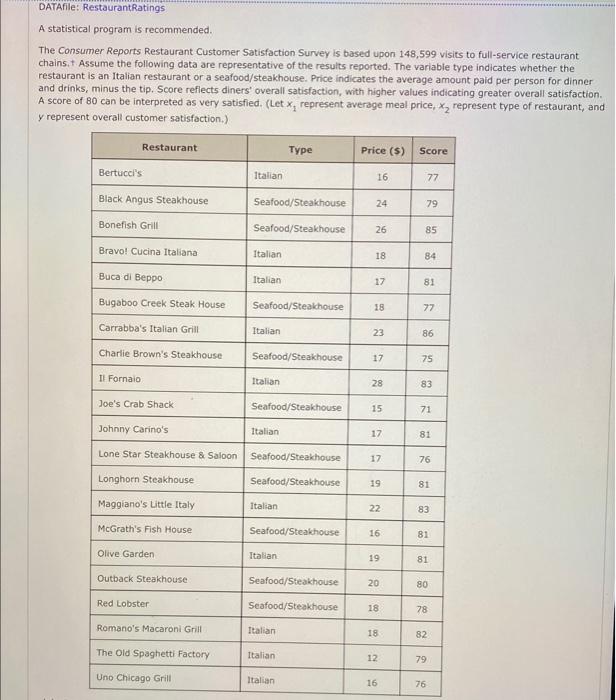
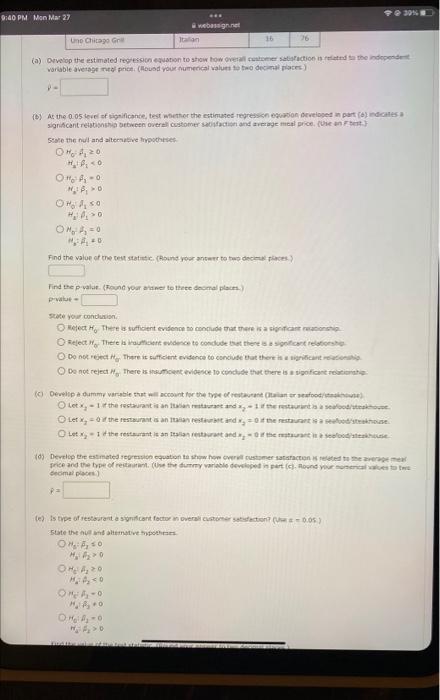
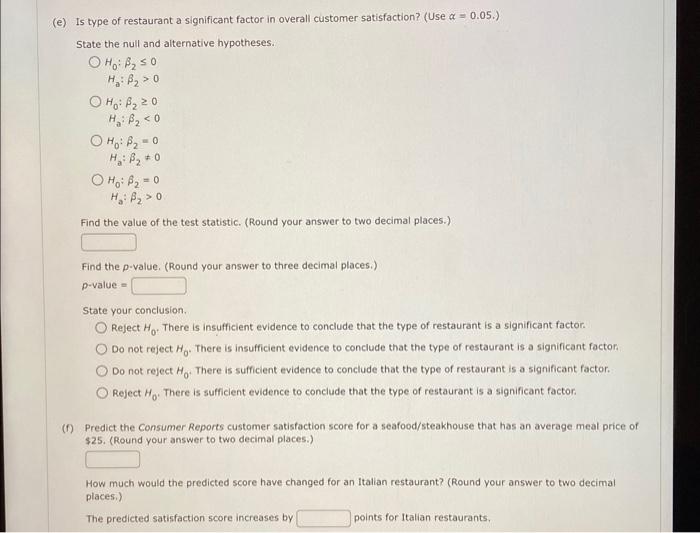
A statistical program is recommended. The Consumer Reports Restaurant Customer Satisfaction Survey is based upon 148.599 yisits to full-service restairant chains, 1 Assume the following data are representative of the results reported. The variable type indicates whether the restaurant is an ftalian restaurant or a seafood/steakhouse. Price indicates the average amount paid per permon for dinner and drinks, minus the tig. Score reflects difiers' overall satisfaction. with higher values indicating greater overall satisfaction. A score of B9 can be interpreted as very satisfied. (tet x, represent average meal price, x2 represent type of restaurant, and y represent overall customer satisfaction.) (a) Develop the estimated regression equation to show how overall customer satisfaction is related to the independent variabie average meal pnice (Round your numenci values to two decimal places.) ^= (b) At the 0.05 level of significance, test whether the estimated regression equation developed in part (a) indicates a significant relationship between overall rustomer satisfaction and average meal price. (Use an F test.) State the null and alternative hypotheses. H0:10Ha:10H0:10Ha:1>0H0:1=0H0:10 Find the value of the test statistic. (Round your answer to two decimal places.) Find the p-value. (Round your answer to three decimal places.) p-value = State your condusion. Reject H0. There is sufficient evidence to conclude that there is a significant relationship. Reject H0. There is insufficient evidence to conclude that there is a significant relationship. Do not reject H0. There is sufficient evidence to conclude that there is a significant relationship. Do not reject H0. There is insufficient evidence to conclude that there is a significant relationship. (c) Develop a dummy variable that will account for the type of restaurant (Italian or seafood/steakhouse). Let x2=1 if the restaurant is an Italian restaurant and xy=1 if the restaurant is a seafood/steakhause. Let x2=0 if the restaurant is an Itallan restaurant and x2=0 if the restaurant is a seafood/steakhouse. Let x2=1 if the restaurant is an Italian restaurant and x2=0 if the restaurant is a seafood/steakhouse. (d) Develop the estimated regression equation to show how overall customer satisfaction is related to the average meal price and the type of restaurant. (Use the dummy variable developed in part (c). Round your numerical velues to twe decimal places.) y= (e) Is type of restaurant a significant factor in overall customer satisfaction? (Use =0.05.) State the null and aiternative hypotheses. H0:20H0:2>0H0:20Ha:20 Find the value of the test statistic. (Round your answer to two decimal places.) Find the p-value. (Round your answer to three decimal places.) p-value = State your conclusion. Reject H0. There is insufficient evidence to conclude that the type of restaurant is a significant factoc. Do not reject H0. There is insufficient evidence to conclude that the type of restaurant is a significant factor. Do not reject H0. There is sufficient evidence to conclude that the type of restaurant is a significant factor. Reject H0, There is surficient evidence to conclude that the type of restaurant is a significant factor. Predict the Consumer Reports customer satisfaction score for a seafood/steakhouse that has an average meal price of $25. (Round your answer te two decimal places.) How much would the predicted score have changed for an Italian restaurant? (Round your answer to two decimal places.) The predicted satisfaction score increases by points for ftalian restaurants. DATAfile: RestaurantRatings A statistical program is recommended. The Consumer Reports Restaurant Customer Satisfaction Survey is based upon 148,599 visits to full-service restaurant chains. . Assume the following data are representative of the results reported. The variable type indicates whether the restaurant is an Italian restaurant or a seafood/steakhouse. Price indicates the average amount paid per person for dinner and drinks, minus the tip. Score reflects diners' overall satisfaction, with higher values indicating greater overall satisfaction. A score of 80 can be interpreted as very satisfied. (Let x1 represent average meal price, x2 represent type of restaurant, and y represent overall customer satisfaction.) Segie the hull and alterapetive frrpotheses H0,r20H1+10M2f1=0n2z1=0 Find the p valie. (Found your altwet to theee desmal placts.) prvatue - Frate your contlanisn. Refect Hor The e a iraiathathe widesce to condlode that there is a spoifcast rebsoeshe Seomal plosen? p^= State the nul and alitmative mpoelrars H3P2=0BH1H2>0HCH20HaH20 (e) Is type of restaurant a significant factor in overall customer satisfaction? (Use =0.05.) State the null and alternative hypotheses. H0:20Ha:2>0H0:20Ha:20 Find the value of the test statistic. (Round your answer to two decimal places.) Find the p-value. (Round your answer to three decimal places.) p-value= State your conclusion. Reject H0. There is insufficient evidence to conclude that the type of restaurant is a significant factor. Do not reject H0. There is insufficient evidence to conclude that the type of restaurant is a significant factor: Do not reject H0. There is sufficient evidence to conclude that the type of restaurant is a significant factor. Reject H0. There is sufficient evidence to conclude that the type of restaurant is a significant factor. (f) Predict the Consumer Reports customer satisfaction score for a seafood/steakhouse that has an average meal price of \$25. (Round your answer to two decimal places.) How much would the predicted score have changed for an Italian restaurant? (Round your answer to two decimal places.) The predicted satisfaction score increases by points for Italian restaurants
