Answered step by step
Verified Expert Solution
Question
1 Approved Answer
A statistical program is recon Annual retail store revenue for a technology company from 2007 to 2017 are shown below. Year Period Retail Store Revenue
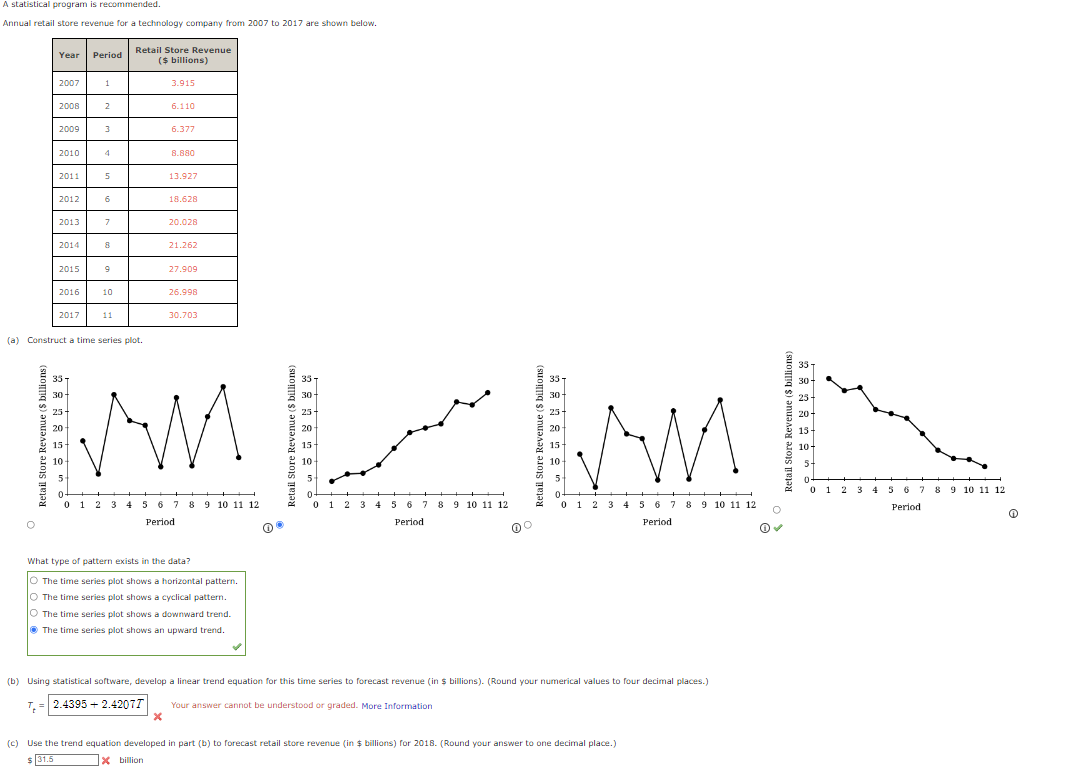
A statistical program is recon Annual retail store revenue for a technology company from 2007 to 2017 are shown below. Year Period Retail Store Revenue ($ billions) 2007 3.915 2006 2 6.110 2009 3 6.377 2010 4 8.880 2011 5 3.927 2017 6 18.628 2013 7 10.028 2014 B 21.262 2015 9 27.909 2016 10 6.998 2017 11 30.703 (a) Construct a time series plot. Retail Store Revenue ($ billions) MM Retail Store Revenue ($ billions) 20 Retail Store Revenue ($ billions) Retail Store Revenue ($ billions) 10 of 0 1 2 3 7 8 9 10 11 12 2 3 5 6 7 8 9 10 11 12 1 2 5 6 7 8 9 10 11 12 1 2 3 4 5 6 7 8 9 10 11 12 O Period Period Period Period What type of pattern exists in the data? O The time series plot shows a horizontal pattern. The time series plot shows a cyclical pattern. The time series plot shows a downward trend. The time series plot shows an upward trend. (b) Using statistical software, develop a linear trend equation for this time series to forecast revenue (in $ billions). (Round your numerical values to four decimal places.) T- = 2.4395 + 2.42077 Your answer cannot be understood or graded. More Information (c) Use the trend equation developed in part (b) to forecast retail store revenue (in $ billions) for 2018. (Round your answer to one decimal place.) $ 31.5 X bilion
Step by Step Solution
There are 3 Steps involved in it
Step: 1
Get Instant Access to Expert-Tailored Solutions
See step-by-step solutions with expert insights and AI powered tools for academic success
Step: 2
Step: 3
Ace Your Homework with AI
Get the answers you need in no time with our AI-driven, step-by-step assistance
Get Started