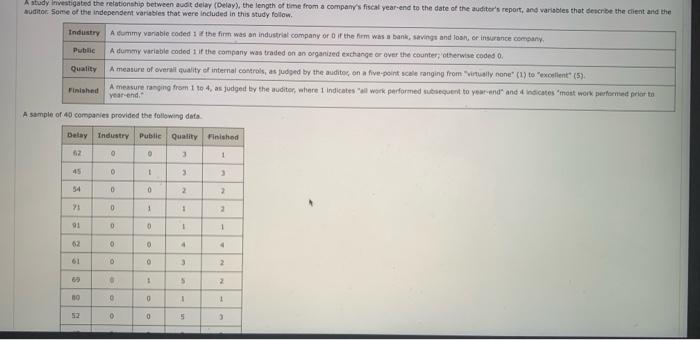
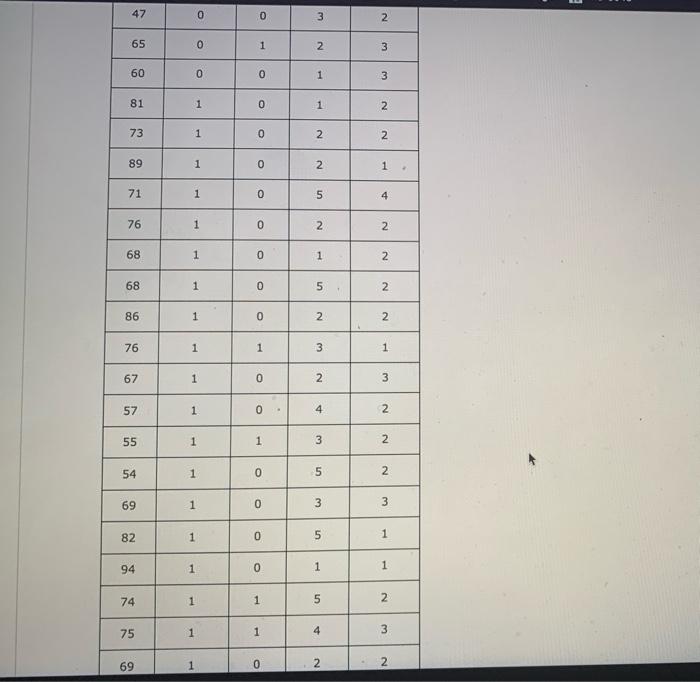
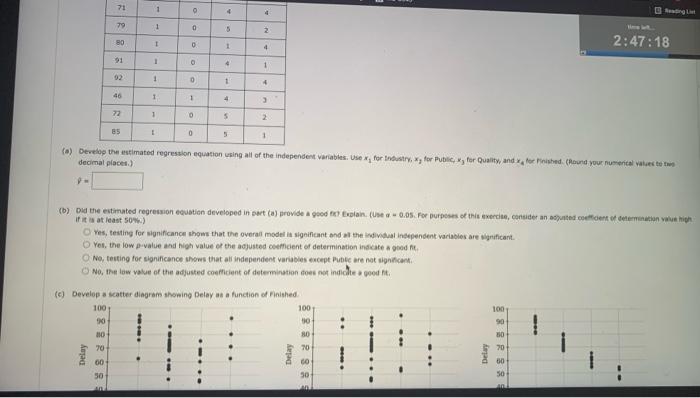
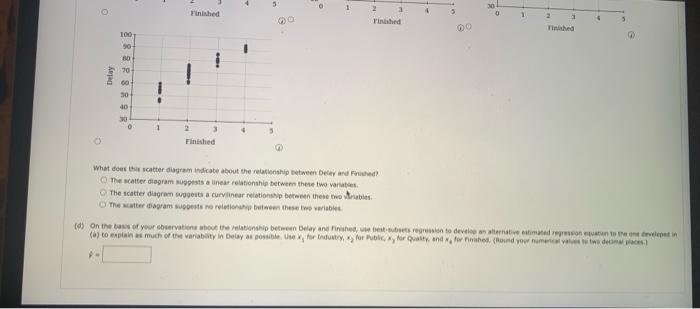
A study investigated the relationship between audit delay (Delay), the length of time from a company's fiscal year-end to the date of the auditor's report, and variables that describe the client and the auditor Some of the independent variables that were included in this study follow Industry A Gummy variable coded the firm was an industrial company or if the firm was a bank, Savings and toon, or insurance company Public A dummy variable coded if the company was traded on an organized exchange or over the counter, otherwise coded Quality A measure of overall quality of internal controls, as judged by the auditor on a five-point scale ranging from "Virtually none" (1) to excellent (5) Finished A measure ranging from 1 to 4, as judged by the auditor, where indicates work performed subsequent to your end and indicates most work performed prior to Year-end. A sample of 40 companies provided the following data Delay Industry Publie Quality Finished 62 3 1 45 0 1 3 3 54 0 0 2 2 0 1 1 2 91 0 0 1 02 o 0 4 61 0 3 2 1 5 2 SS 0 1 1 12 O 0 47 0 0 3 N 65 0 0 1 N 3 60 0 1 3 0 0 81 1 1 2 73 1 0 2 2. 89 1 0 2 1 71 1 0 5 4 76 1 0 2 N 68 1 O 1 2 68 1 0 un 2. 2 86 1 0 2 2 76 1 1 1 1 67 1 0 2 3 57 1 0 4 N 55 1 1 3 N 2 54 1 0 0 5 N 69 1 1 0 3 3 3 82 1 0 5 1 94 1 1 o 0 1 0 1 1 74 1 1 1 5 N 75 1 1 4 3 69 1 0 2 N . 71 1 O 4 79 1 - 5 2 80 1 2:47:18 0 4 91 1 1 02 1 0 1 4 46 1 1 4 4 3 72 1 5 2 1 85 0 5 (a) Develop the estimated regression equation using all of the independent variables. Use for Industry for Publicy for Quality and for Fished. Round your numerical textos decimal places) (b) Du the estimated repression equation developed in part (a) provide a good to bolan. (U 0.05.Por purposes of this exercise, conter un outed count of termen lui if it is at least 50%) Yes, testing for significance shows that the overal model is significant and the individual independent variables are significant Yes, the low p value and high value of the adjusted coefficient of determination indicate a good No, testing for significance shows that all independent varies except Pubic are not significant No, the low value of the adjusted coefficient of determination does not indichepood (c) Develop a scatter diagram showing Delay as a function of Finished 1001 100 90 30 90 80 30 70 00 50 100 30 70 70 Delay GO 50 30 30 - 5 1 o Finished 2 a Finished 1 GO 6 1 Thed 100 50 0 70 ! Delay 888 30 0 1 2 3 Finished What does the scatter diagram indicate about the relationship between Delay and Fished! The scatter diagram sugests a linear relationship between these two var The scatter diagra wogests a curvilinear relationship between these two rubles The water agram sunt relation between these two (d) on the base of your brain out the relationship between Delay and sheets represion to develom tematem repone to enten (a) to explains much of the variability in Delay as one for Indy for Por Quatty and without your minden A study investigated the relationship between audit delay (Delay), the length of time from a company's fiscal year-end to the date of the auditor's report, and variables that describe the client and the auditor Some of the independent variables that were included in this study follow Industry A Gummy variable coded the firm was an industrial company or if the firm was a bank, Savings and toon, or insurance company Public A dummy variable coded if the company was traded on an organized exchange or over the counter, otherwise coded Quality A measure of overall quality of internal controls, as judged by the auditor on a five-point scale ranging from "Virtually none" (1) to excellent (5) Finished A measure ranging from 1 to 4, as judged by the auditor, where indicates work performed subsequent to your end and indicates most work performed prior to Year-end. A sample of 40 companies provided the following data Delay Industry Publie Quality Finished 62 3 1 45 0 1 3 3 54 0 0 2 2 0 1 1 2 91 0 0 1 02 o 0 4 61 0 3 2 1 5 2 SS 0 1 1 12 O 0 47 0 0 3 N 65 0 0 1 N 3 60 0 1 3 0 0 81 1 1 2 73 1 0 2 2. 89 1 0 2 1 71 1 0 5 4 76 1 0 2 N 68 1 O 1 2 68 1 0 un 2. 2 86 1 0 2 2 76 1 1 1 1 67 1 0 2 3 57 1 0 4 N 55 1 1 3 N 2 54 1 0 0 5 N 69 1 1 0 3 3 3 82 1 0 5 1 94 1 1 o 0 1 0 1 1 74 1 1 1 5 N 75 1 1 4 3 69 1 0 2 N . 71 1 O 4 79 1 - 5 2 80 1 2:47:18 0 4 91 1 1 02 1 0 1 4 46 1 1 4 4 3 72 1 5 2 1 85 0 5 (a) Develop the estimated regression equation using all of the independent variables. Use for Industry for Publicy for Quality and for Fished. Round your numerical textos decimal places) (b) Du the estimated repression equation developed in part (a) provide a good to bolan. (U 0.05.Por purposes of this exercise, conter un outed count of termen lui if it is at least 50%) Yes, testing for significance shows that the overal model is significant and the individual independent variables are significant Yes, the low p value and high value of the adjusted coefficient of determination indicate a good No, testing for significance shows that all independent varies except Pubic are not significant No, the low value of the adjusted coefficient of determination does not indichepood (c) Develop a scatter diagram showing Delay as a function of Finished 1001 100 90 30 90 80 30 70 00 50 100 30 70 70 Delay GO 50 30 30 - 5 1 o Finished 2 a Finished 1 GO 6 1 Thed 100 50 0 70 ! Delay 888 30 0 1 2 3 Finished What does the scatter diagram indicate about the relationship between Delay and Fished! The scatter diagram sugests a linear relationship between these two var The scatter diagra wogests a curvilinear relationship between these two rubles The water agram sunt relation between these two (d) on the base of your brain out the relationship between Delay and sheets represion to develom tematem repone to enten (a) to explains much of the variability in Delay as one for Indy for Por Quatty and without your minden


