A study of the ability of individuals to walk in a straight line reported the accompanying data on cadence (strides per second) for a sample
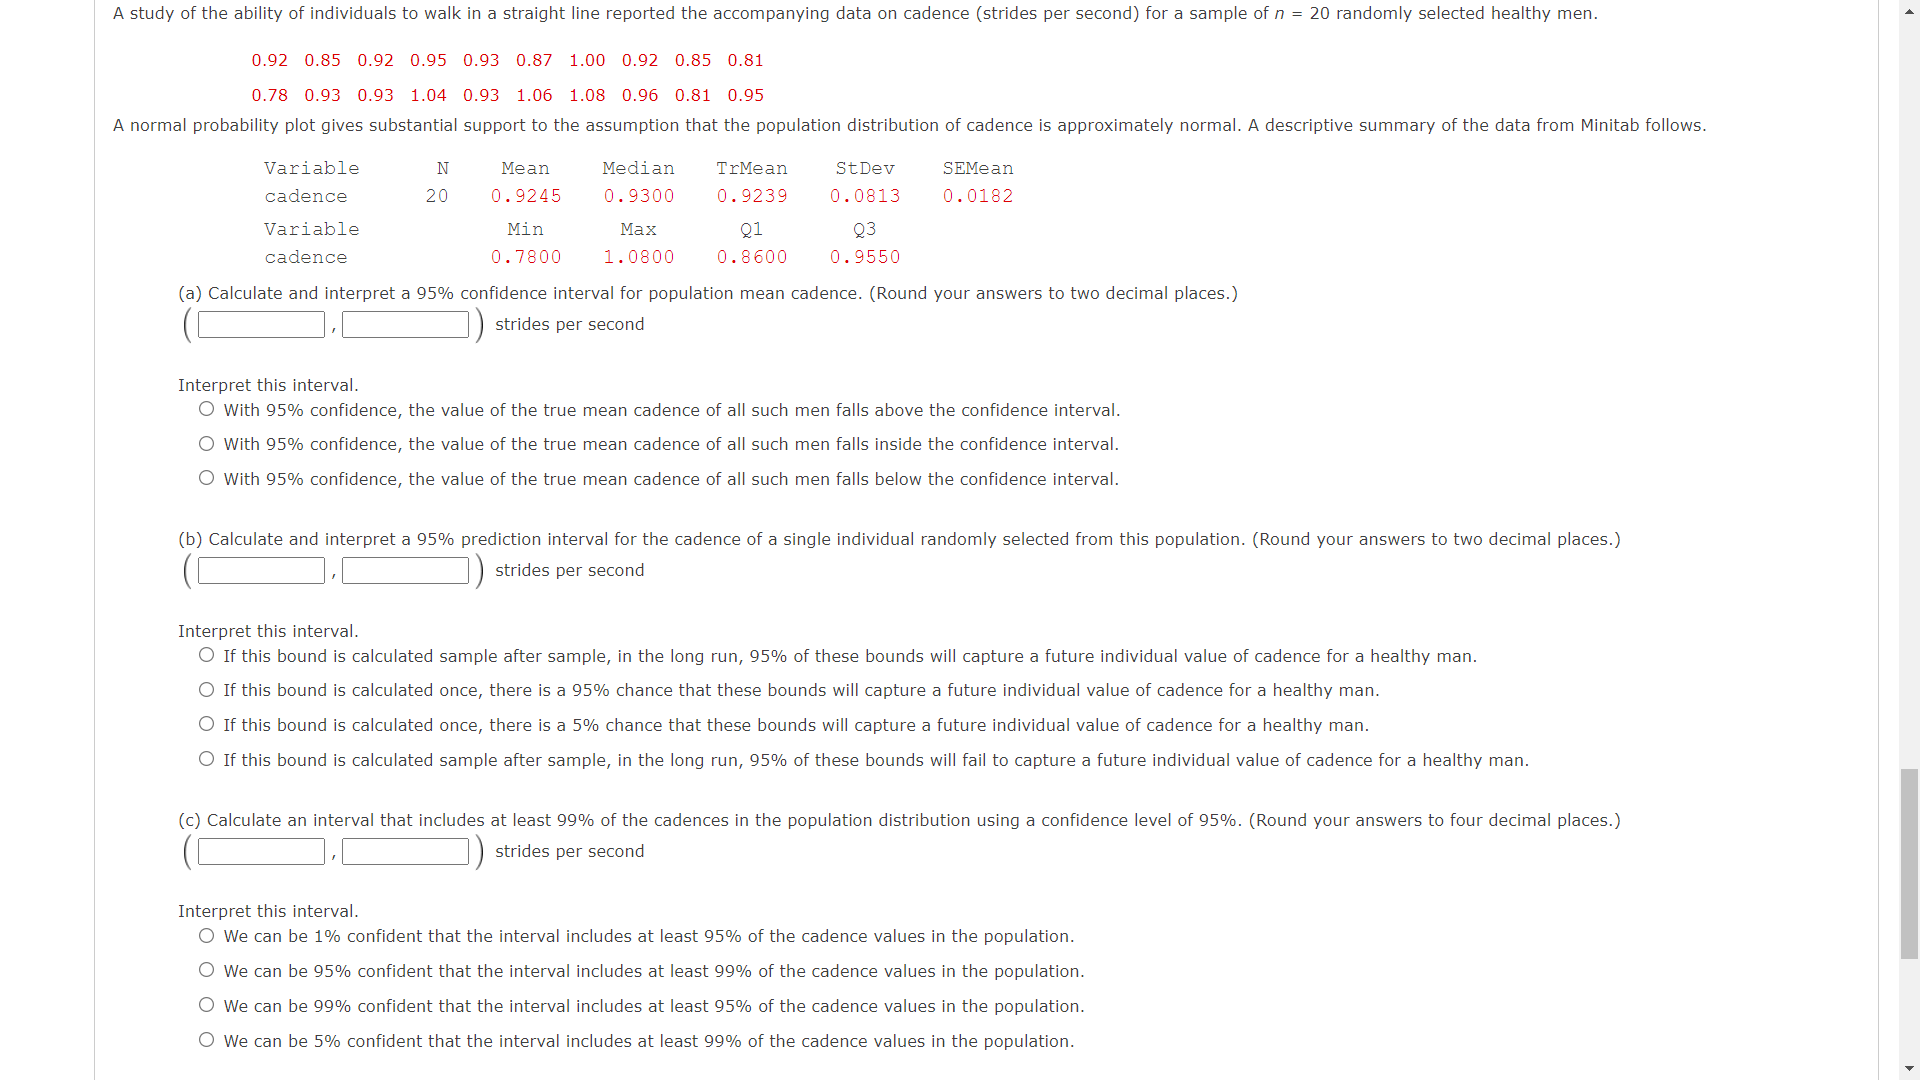
A study of the ability of individuals to walk in a straight line reported the accompanying data on cadence (strides per second) for a sample of .n : 20 randomly selected healthy men. 0.92 0.85 0.92 0.95 0.93 0.87 1.00 0.92 0.85 0.81 0.78 0.93 0.93 1.04 0.93 1.06 1.08 0.96 0.81 0.95 A normal probability plot gives substantial support to the assumption that the population distribution of cadence is approximately normal. A descriptive summary of the data from Minitab follows. Variable N Mean Median TrMean StDev SEMean cadence 20 0.9245 0.9300 0.9239 0.0813 0.0182 Variable Min Max (21 Q} cadence 0t7800 1t0800 0.8600 0.9550 (a) Calculate and interpret a 95% confidence interval for population mean cadence. (Round your answers to two decimal places.) (:I . S) strides Der semnd Interpret this interval. 0 With 95% confidence, the Value of the true mean Cadence of all such men falls above the confidence interval. 0 With 95% confidence, the Value of the true mean Cadence of all such men falls inside the confidence interval. 0 With 95% confidence, the value of the true mean cadence of all such men falls below the condence interval. (b) Calculate and interpret a 95% prediction interval for the cadence of a single individual randomly selected from this population. (Round your answers to two decimal places.) Interpret this interval. 0 If this bound is calculated sample after sample, in the long run, 95% of these bounds will capture a future individual value of cadence for a healthy man. 0 If this bound is calculated once, there is a 95% chance that these bounds will capture a future individual value of cadence for a healthy man. 0 If this bound is calculated once, there is a 5% chance that these bounds will capture a future individual value of cadence for a healthy man. 0 If this bound is calculated sample after sample, in the long run, 95% of these bounds will fail to capture a future individual value of cadence for a healthy man. (c) Calculate an interval that includes at least 99% of the cadences in the population distribution using a confidence level of 95%. (Round your answers to four decimal places.) (:I . S) strides per second Interpret this interval. 0 We can be 1% confident that the interval includes at least 95% of the cadence values in the population. 0 We can be 95% confident that the interval includes at least 99% of the cadence values in the population. 0 We can be 99% confident that the interval includes at least 95% of the cadence Values in the population. 0 We can be 5% confident that the interval includes at least 99% of the cadence values in the population
Step by Step Solution
There are 3 Steps involved in it
Step: 1
Get Instant Access to Expert-Tailored Solutions
See step-by-step solutions with expert insights and AI powered tools for academic success
Step: 2
Step: 3
Ace Your Homework with AI
Get the answers you need in no time with our AI-driven, step-by-step assistance