

Answered step by step
Verified Expert Solution
Question
1 Approved Answer
A supermarket is planning to locate warehouses in the districts of a city. The supermarket delivers and stocks two types of products; food and
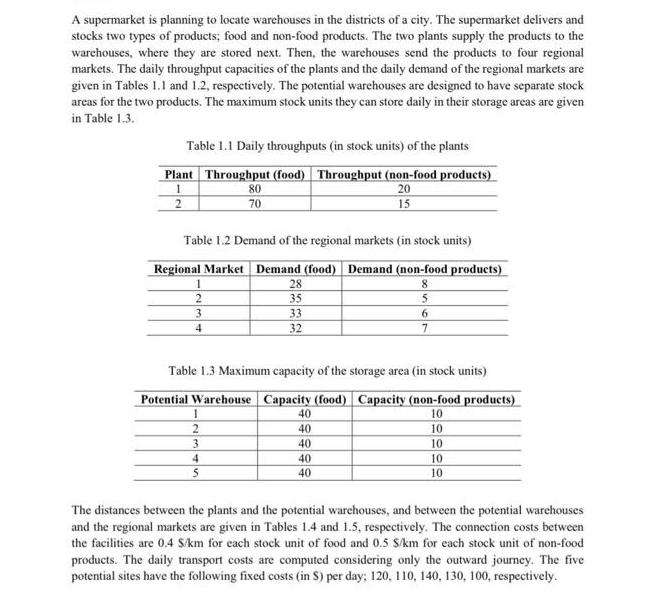
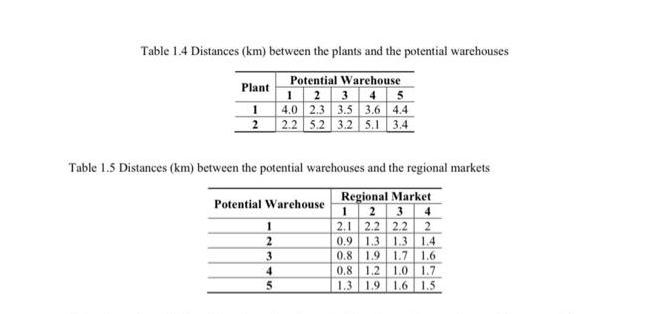
A supermarket is planning to locate warehouses in the districts of a city. The supermarket delivers and stocks two types of products; food and non-food products. The two plants supply the products to the warehouses, where they are stored next. Then, the warehouses send the products to four regional markets. The daily throughput capacities of the plants and the daily demand of the regional markets are given in Tables 1.1 and 1.2, respectively. The potential warehouses are designed to have separate stock areas for the two products. The maximum stock units they can store daily in their storage areas are given in Table 1.3. Table 1.1 Daily throughputs (in stock units) of the plants Plant Throughput (food) Throughput (non-food products) 1 2 80 70 20 15 Table 1.2 Demand of the regional markets (in stock units) Regional Market Demand (food) Demand (non-food products) 1 28 2 35 3 33 4 32 8 5 6 7 Table 1.3 Maximum capacity of the storage area (in stock units) Potential Warehouse Capacity (food) Capacity (non-food products) I 2 3 4 5 40 40 40 499 40 40 10 10 10 10 10 The distances between the plants and the potential warehouses, and between the potential warehouses and the regional markets are given in Tables 1.4 and 1.5, respectively. The connection costs between the facilities are 0.4 S/km for each stock unit of food and 0.5 S/km for each stock unit of non-food products. The daily transport costs are computed considering only the outward journey. The five potential sites have the following fixed costs (in S) per day: 120, 110, 140, 130, 100, respectively. Table 1.4 Distances (km) between the plants and the potential warehouses Plant Potential Warehouse 1 2 3 4 5 1 4.0 2.3 3.5 3.6 4.4 2.2 5.2 3.2 5.1 3.4 Table 1.5 Distances (km) between the potential warehouses and the regional markets Potential Warehouse Regional Market 1 2 3 4 2.1 2.2 2.2 2 0.9 1.3 1.3 1.4 1 2 3 0.8 1.9 1.7 1.6 4 0.8 1.2 1.0 1.7 5 1.3 1.9 1.6 1.5 INSTRUCTIONS Write the mathematical model to determine the optimal locations of the warehouses. Use aj and bir instead of Sir Clearly define all the DVs, the parameters you use, and explain briefly the constraints. You can write the model in generic form, but make sure that you write one example open-form for each constraint.
Step by Step Solution
★★★★★
3.40 Rating (150 Votes )
There are 3 Steps involved in it
Step: 1
To optimize the location of the warehouses and minimize the total costs we can use a facility location and allocation model The objective is to determ...
Get Instant Access to Expert-Tailored Solutions
See step-by-step solutions with expert insights and AI powered tools for academic success
Step: 2

Step: 3
Ace Your Homework with AI
Get the answers you need in no time with our AI-driven, step-by-step assistance
Get Started
Introduction to Management Science
Authors: Bernard W. Taylor
11th Edition
132751917, 978-0132751919