

Answered step by step
Verified Expert Solution
Question
1 Approved Answer
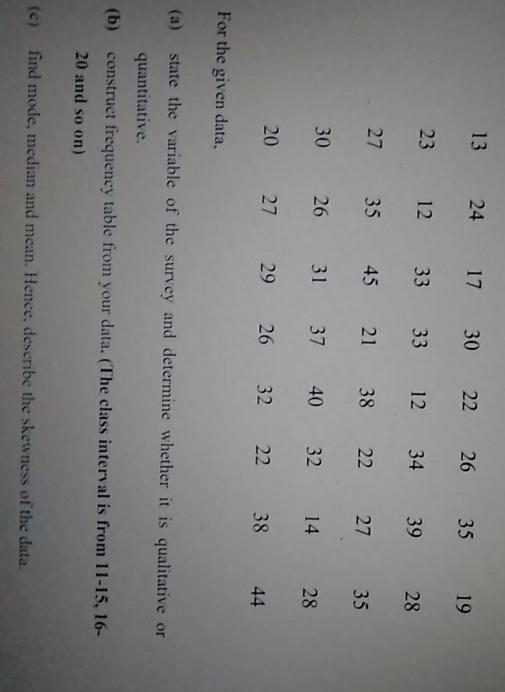
a survey on the total daily expenditure (RM) on buying foods using Food Panda service has been conducted on 40 households in a certain residential

a survey on the total daily expenditure (RM) on buying foods using Food Panda service has been conducted on 40 households in a certain residential area.The following results are obtained as follows.
Step by Step Solution
There are 3 Steps involved in it
Step: 1

Get Instant Access to Expert-Tailored Solutions
See step-by-step solutions with expert insights and AI powered tools for academic success
Step: 2

Step: 3
Ace Your Homework with AI
Get the answers you need in no time with our AI-driven, step-by-step assistance
Get Started
The Art And Craft Of Problem Solving
Authors: Paul Zeitz
3rd Edition
1119094844, 9781119094845