Question
A survey was conducted at a local food court. People were asked if they would like to have a pizza, a sandwich, or a


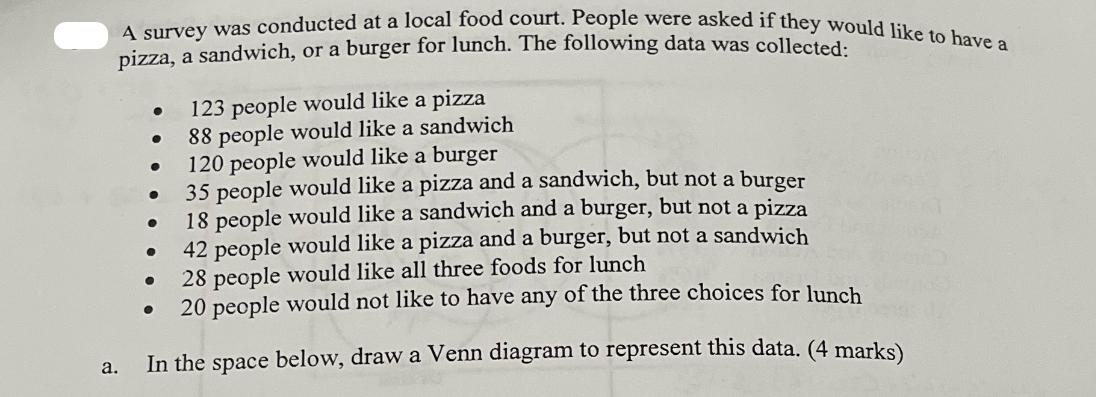
A survey was conducted at a local food court. People were asked if they would like to have a pizza, a sandwich, or a burger for lunch. The following data was collected: a. 120 people would like a burger 35 people would like a pizza and a sandwich, but not a burger 18 people would like a sandwich and a burger, but not a pizza 42 people would like a pizza and a burger, but not a sandwich 28 people would like all three foods for lunch 20 people would not like to have any of the three choices for lunch In the space below, draw a Venn diagram to represent this data. (4 marks) 123 people would like a pizza 88 people would like a sandwich b. How many people were surveyed? (1 mark) C. How many people would like to have at least one of these choices for lunch? (1 mark)
Step by Step Solution
There are 3 Steps involved in it
Step: 1

Get Instant Access to Expert-Tailored Solutions
See step-by-step solutions with expert insights and AI powered tools for academic success
Step: 2

Step: 3

Ace Your Homework with AI
Get the answers you need in no time with our AI-driven, step-by-step assistance
Get StartedRecommended Textbook for
Essentials Of Statistics For Business And Economics
Authors: David Anderson, Thomas Williams, Dennis Sweeney, Jeffrey Cam
7th Edition
1305081595, 978-1305081598
Students also viewed these Mathematics questions
Question
Answered: 1 week ago
Question
Answered: 1 week ago
Question
Answered: 1 week ago
Question
Answered: 1 week ago
Question
Answered: 1 week ago
Question
Answered: 1 week ago
Question
Answered: 1 week ago
Question
Answered: 1 week ago
Question
Answered: 1 week ago
Question
Answered: 1 week ago
Question
Answered: 1 week ago
Question
Answered: 1 week ago
Question
Answered: 1 week ago
Question
Answered: 1 week ago
Question
Answered: 1 week ago
Question
Answered: 1 week ago
Question
Answered: 1 week ago
Question
Answered: 1 week ago
Question
Answered: 1 week ago
Question
Answered: 1 week ago
Question
Answered: 1 week ago
Question
Answered: 1 week ago
View Answer in SolutionInn App


