Answered step by step
Verified Expert Solution
Question
1 Approved Answer
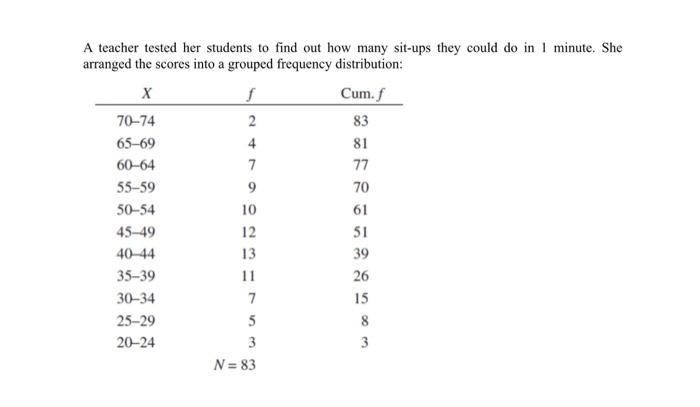
A teacher tested her students to find out how many sit-ups they could do in 1 minute. She arranged the scores into a grouped


A teacher tested her students to find out how many sit-ups they could do in 1 minute. She arranged the scores into a grouped frequency distribution: X f Cum.f 70-74 2 83 65-69 4 81 60-64 7 55-59 9 50-54 10 45-49 12 40-44 13 35-39 11 30-34 7 25-29 5 20-24 3 N = 83 77 70 61 51 39 26 15 8 3 6. What scores best represent (a) Q: (b) Q: (c) Q?
Step by Step Solution
★★★★★
3.46 Rating (159 Votes )
There are 3 Steps involved in it
Step: 1
x 7074 6569 6064 5559 5054 4549 40 44 3539 3034 ...
Get Instant Access to Expert-Tailored Solutions
See step-by-step solutions with expert insights and AI powered tools for academic success
Step: 2

Step: 3

Ace Your Homework with AI
Get the answers you need in no time with our AI-driven, step-by-step assistance
Get Started


