Question
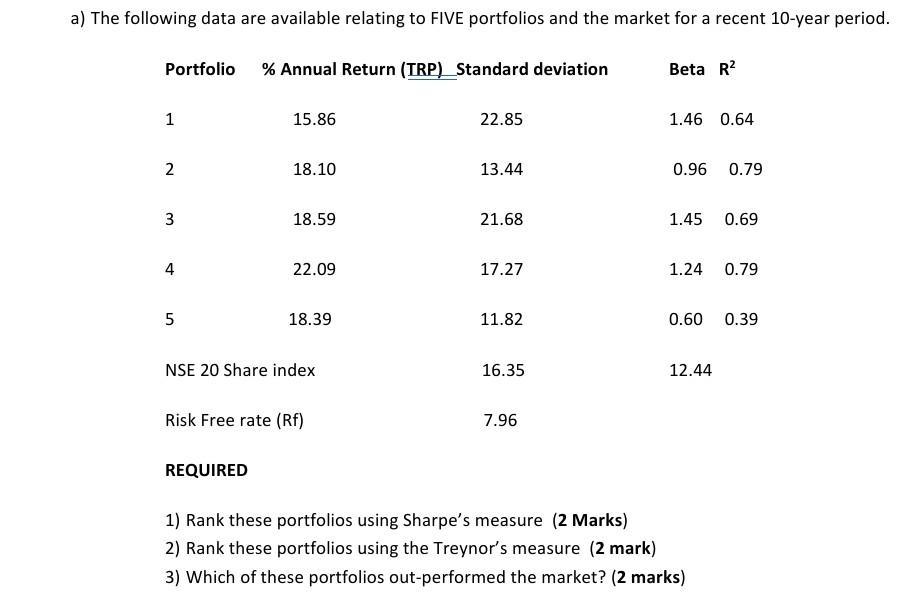
a) The following data are available relating to FIVE portfolios and the market for a recent 10-year period. Portfolio % Annual Return (TRP) Standard

a) The following data are available relating to FIVE portfolios and the market for a recent 10-year period. Portfolio % Annual Return (TRP) Standard deviation Beta R 1 15.86 22.85 1.46 0.64 2 18.10 13.44 0.96 0.79 3 18.59 21.68 1.45 0.69 4 22.09 17.27 1.24 0.79 5 18.39 11.82 0.60 0.39 NSE 20 Share index 16.35 12.44 Risk Free rate (Rf) 7.96 REQUIRED 1) Rank these portfolios using Sharpe's measure (2 Marks) 2) Rank these portfolios using the Treynor's measure (2 mark) 3) Which of these portfolios out-performed the market? (2 marks)
Step by Step Solution
There are 3 Steps involved in it
Step: 1

Get Instant Access to Expert-Tailored Solutions
See step-by-step solutions with expert insights and AI powered tools for academic success
Step: 2

Step: 3

Ace Your Homework with AI
Get the answers you need in no time with our AI-driven, step-by-step assistance
Get StartedRecommended Textbook for
Corporate Finance and Investment decisions and strategies
Authors: Richard Pike, Bill Neale, Philip Linsley
8th edition
1292064064, 978-1292064161, 1292064161, 978-1292064062
Students also viewed these Finance questions
Question
Answered: 1 week ago
Question
Answered: 1 week ago
Question
Answered: 1 week ago
Question
Answered: 1 week ago
Question
Answered: 1 week ago
Question
Answered: 1 week ago
Question
Answered: 1 week ago
Question
Answered: 1 week ago
Question
Answered: 1 week ago
Question
Answered: 1 week ago
Question
Answered: 1 week ago
Question
Answered: 1 week ago
Question
Answered: 1 week ago
Question
Answered: 1 week ago
Question
Answered: 1 week ago
Question
Answered: 1 week ago
Question
Answered: 1 week ago
Question
Answered: 1 week ago
Question
Answered: 1 week ago
Question
Answered: 1 week ago
Question
Answered: 1 week ago
Question
Answered: 1 week ago
View Answer in SolutionInn App


