Answered step by step
Verified Expert Solution
Question
1 Approved Answer
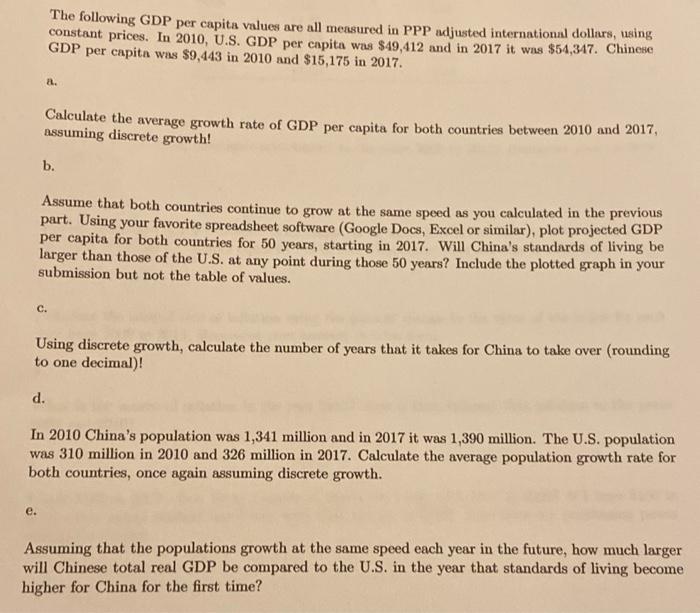
a. The following GDP per capita values are all measured in PPP adjusted international dollars, using constant prices. In 2010, U.S. GDP per capita

a. The following GDP per capita values are all measured in PPP adjusted international dollars, using constant prices. In 2010, U.S. GDP per capita was $49,412 and in 2017 it was $54,347. Chinese GDP per capita was $9,443 in 2010 and $15,175 in 2017. Calculate the average growth rate of GDP per capita for both countries between 2010 and 2017, assuming discrete growth! b. Assume that both countries continue to grow at the same speed as you calculated in the previous part. Using your favorite spreadsheet software (Google Docs, Excel or similar), plot projected GDP per capita for both countries for 50 years, starting in 2017. Will China's standards of living be larger than those of the U.S. at any point during those 50 years? Include the plotted graph in your submission but not the table of values. C. Using discrete growth, calculate the number of years that it takes for China to take over (rounding to one decimal)! d. In 2010 China's population was 1,341 million and in 2017 it was 1,390 million. The U.S. population was 310 million in 2010 and 326 million in 2017. Calculate the average population growth rate for both countries, once again assuming discrete growth. Assuming that the populations growth at the same speed each year in the future, how much larger will Chinese total real GDP be compared to the U.S. in the year that standards of living become higher for China for the first time?
Step by Step Solution
★★★★★
3.49 Rating (162 Votes )
There are 3 Steps involved in it
Step: 1

Get Instant Access to Expert-Tailored Solutions
See step-by-step solutions with expert insights and AI powered tools for academic success
Step: 2

Step: 3

Ace Your Homework with AI
Get the answers you need in no time with our AI-driven, step-by-step assistance
Get Started


