Question
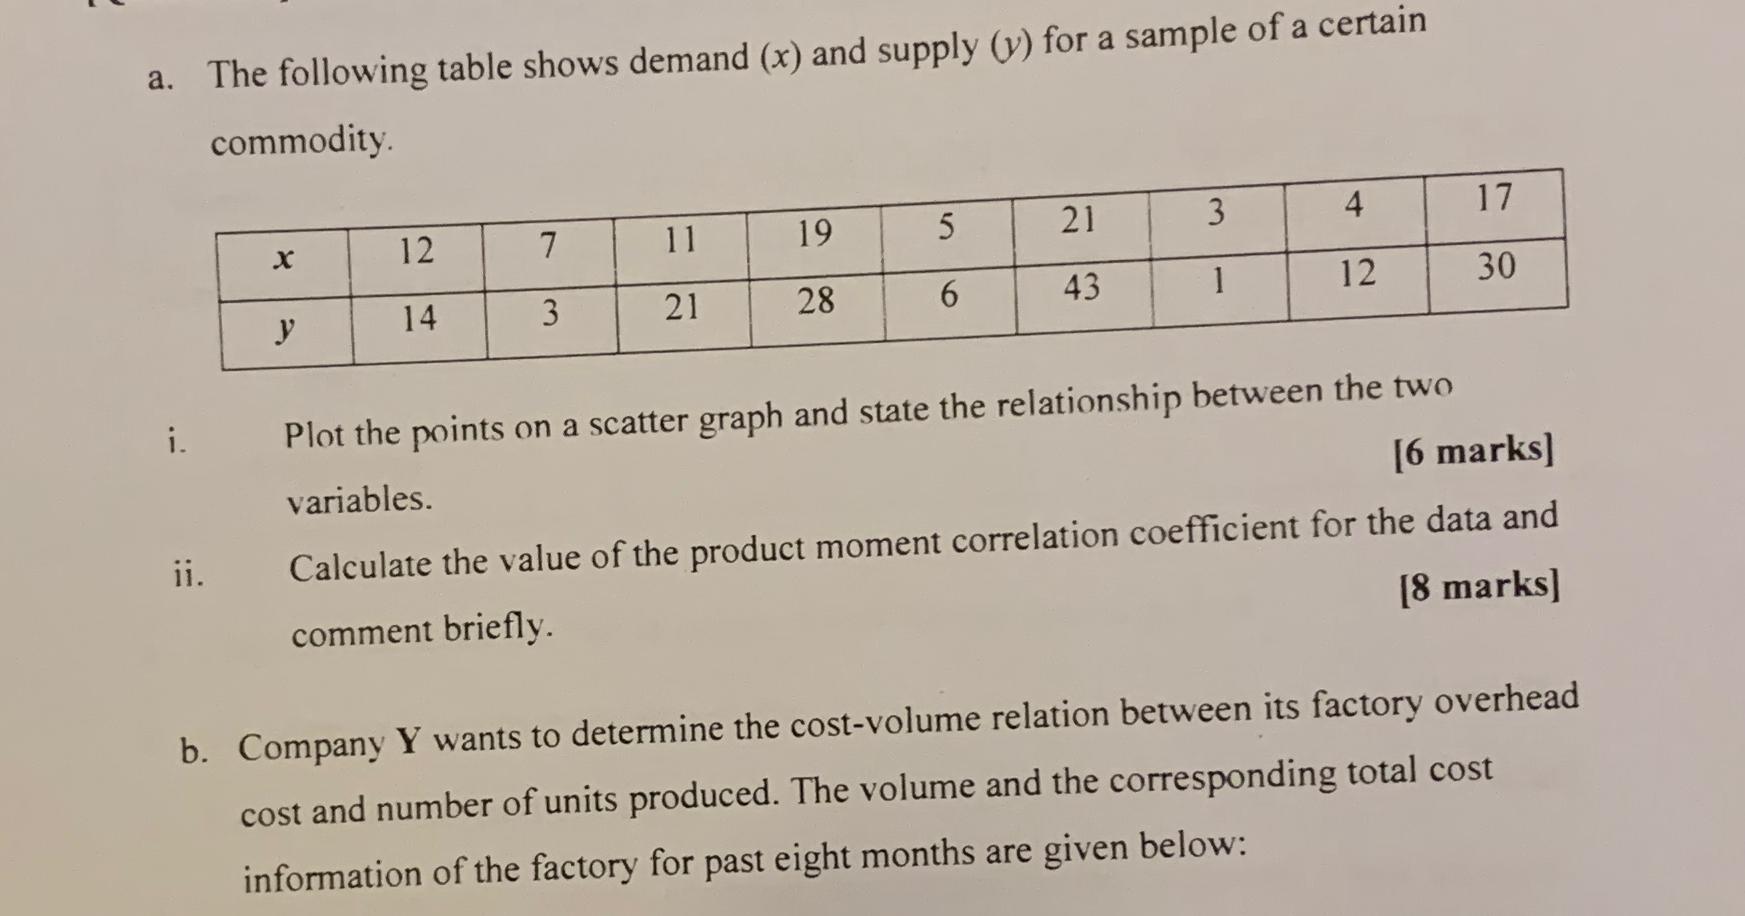
a. The following table shows demand (x) and supply (y) for a sample of a certain commodity. table[[ x ,12,7,11,19,5,21,3,4,17],[ y ,14,3,21,28,6,43,1,12,30]] i. Plot the
a. The following table shows demand
(x)and supply
(y)for a sample of a certain commodity.\ \\\\table[[
x,12,7,11,19,5,21,3,4,17],[
y,14,3,21,28,6,43,1,12,30]]\ i. Plot the points on a scatter graph and state the relationship between the two variables.\ [6 marks]\ ii. Calculate the value of the product moment correlation coefficient for the data and comment briefly.\ [8 marks]\ b. Company
Ywants to determine the cost-volume relation between its factory overhead cost and number of units produced. The volume and the corresponding total cost information of the factory for past eight months are given below:

Step by Step Solution
There are 3 Steps involved in it
Step: 1

Get Instant Access to Expert-Tailored Solutions
See step-by-step solutions with expert insights and AI powered tools for academic success
Step: 2

Step: 3

Ace Your Homework with AI
Get the answers you need in no time with our AI-driven, step-by-step assistance
Get Started


