

Question
(a). The producer's and consumer's risk point were symbolised as alpha and beta points in operational curves respectively. With the data shown in Table 1,
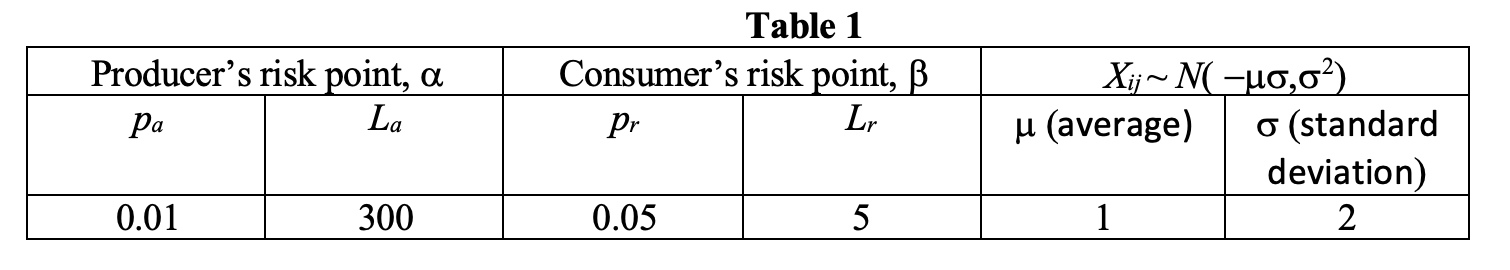
(a). The producer's and consumer's risk point were symbolised as alpha and beta points in operational curves respectively. With the data shown in Table 1, draw a-Chart and derive a sample size for the following set of parameters under action limits only and a single upper specification limit(USL) at USL=0. In your chart please indicate the position of USL, UAL, and center line for the data. No need to write theoretical derivation.
Step by Step Solution
There are 3 Steps involved in it
Step: 1

Get Instant Access to Expert-Tailored Solutions
See step-by-step solutions with expert insights and AI powered tools for academic success
Step: 2

Step: 3
Ace Your Homework with AI
Get the answers you need in no time with our AI-driven, step-by-step assistance
Get Started
Precalculus (Subscription)
Authors: Michael Sullivan, Michael Sullivan III
11th Edition
0135228980, 9780135228982