

Answered step by step
Verified Expert Solution
Question
1 Approved Answer
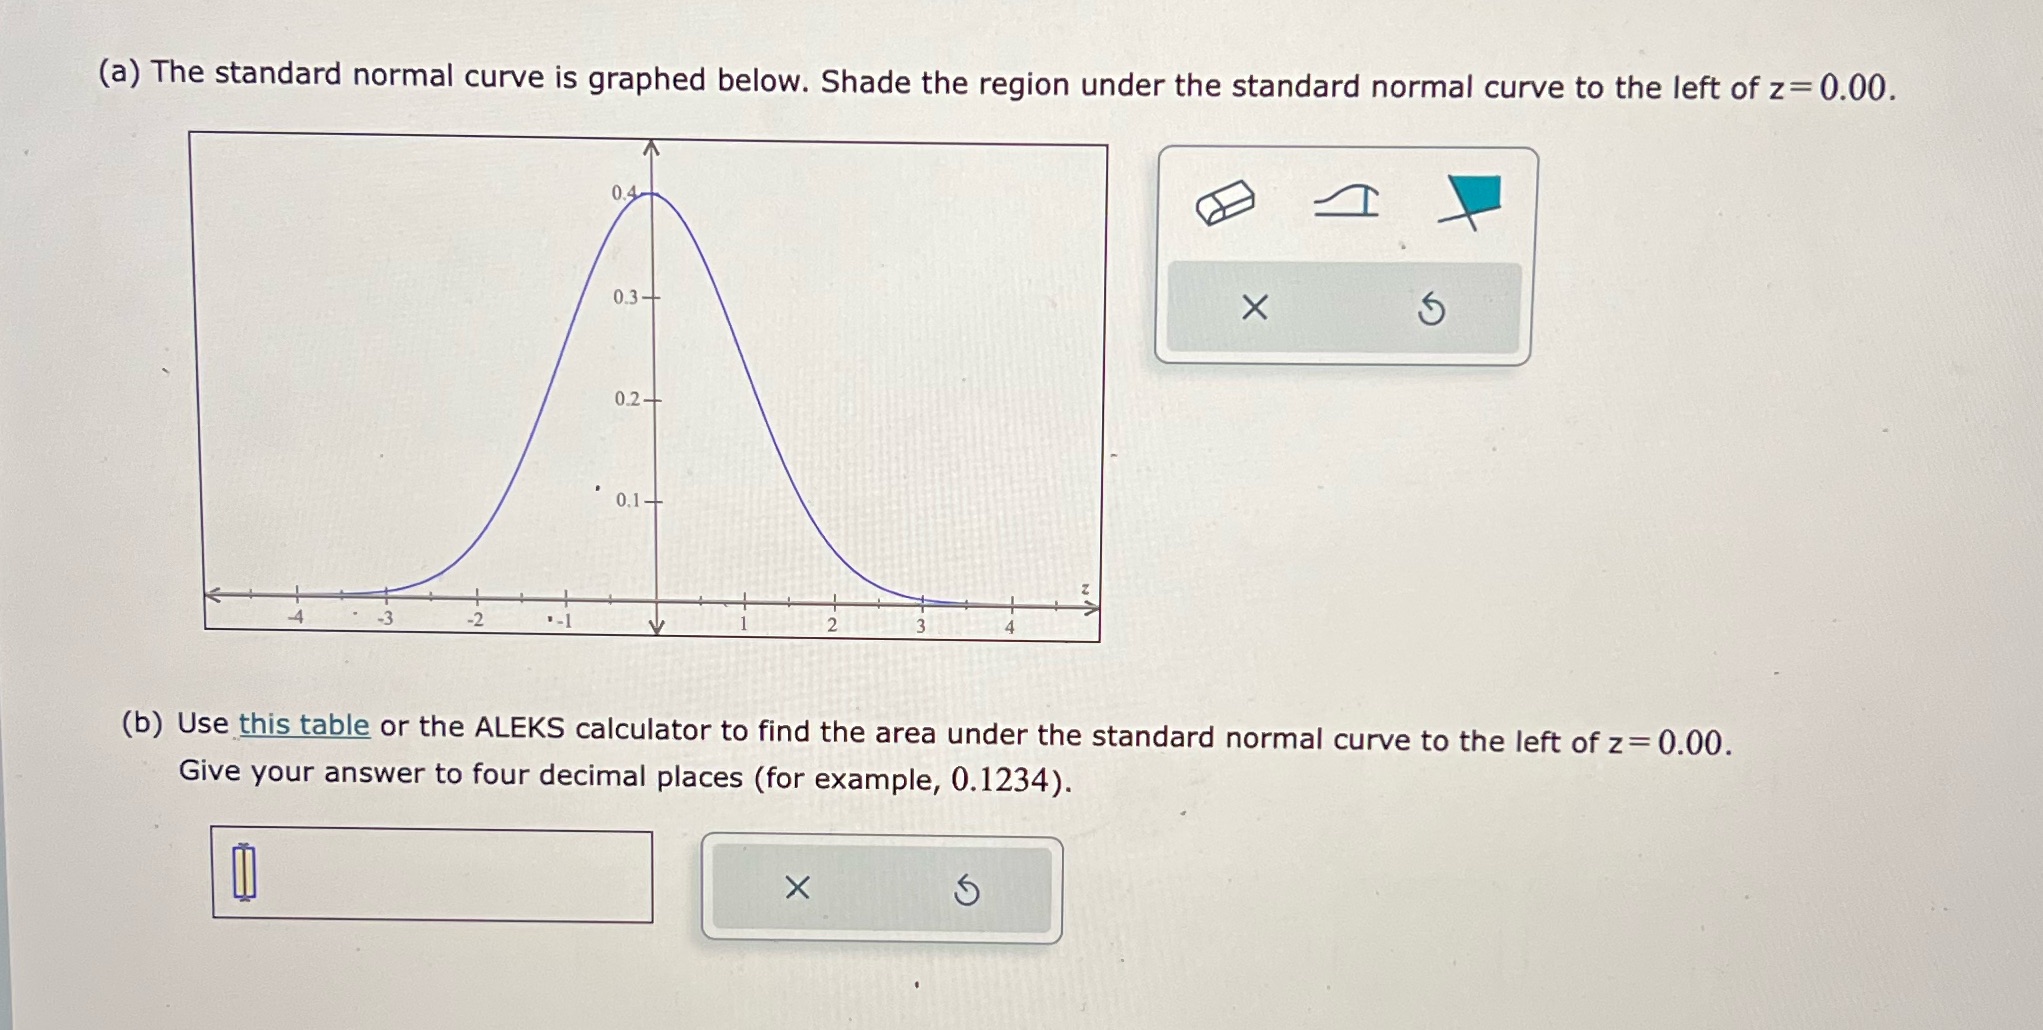
(a) The standard normal curve is graphed below. Shade the region under the standard normal curve to the left of z= 0.00. 0.4- T 0.3+
Step by Step Solution
There are 3 Steps involved in it
Step: 1

Get Instant Access to Expert-Tailored Solutions
See step-by-step solutions with expert insights and AI powered tools for academic success
Step: 2

Step: 3
Ace Your Homework with AI
Get the answers you need in no time with our AI-driven, step-by-step assistance
Get Started
Pell And Pell–Lucas Numbers With Applications
Authors: Thomas Koshy
1st Edition
1461484898, 9781461484899