

Answered step by step
Verified Expert Solution
Question
1 Approved Answer
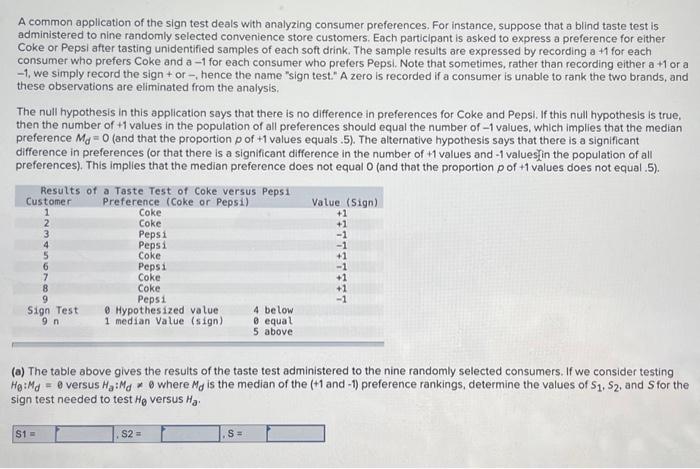
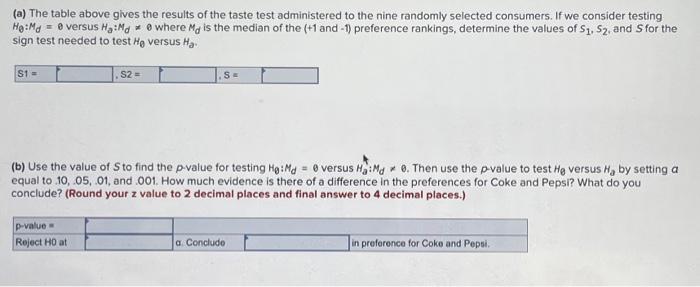
(a) The table above gives the results of the taste test administered to the nine randomly selected consumers. If we consider testing H0:Md= versus Ha:Md=0
Step by Step Solution
There are 3 Steps involved in it
Step: 1

Get Instant Access to Expert-Tailored Solutions
See step-by-step solutions with expert insights and AI powered tools for academic success
Step: 2

Step: 3
Ace Your Homework with AI
Get the answers you need in no time with our AI-driven, step-by-step assistance
Get Started
How Charts Can Help You In The Stock Market
Authors: William Jiler
1st Edition
1265641218, 978-1265641214