Answered step by step
Verified Expert Solution
Link Copied!

Question

1 Approved Answer

A town official claims that the average vehicle in their area sells for more than the 40thpercentile of your data set. Using the data, you

A town official claims that the average vehicle in their area sells formore thanthe 40thpercentile of your data set. Using the data, you obtained in week 1, as well as the summary statistics you found for the original data set (excluding the super car outlier), run a hypothesis test to determine if the claim can be supported.Make sure you state all the important values, so your fellow classmates can use them to run a hypothesis test as well.Use the descriptive statistics you found during Week 2 NOT the new SD you found during Week 4.Because again, we are using the original 10 sample data set NOT a new smaller sample size.Use alpha = .05 to test your claim.

(Note: You will want to use the function =PERCENTILE.INCin Excel to find the 40thpercentile of your data set.Hopefully this Excel function looks familiar to you from Week 2.)

First determine if you are using azort-test and explain why. Then conduct a four-step hypothesis test including a sentence at the end justifying the support or lack of support for the claim and why you made that choice.
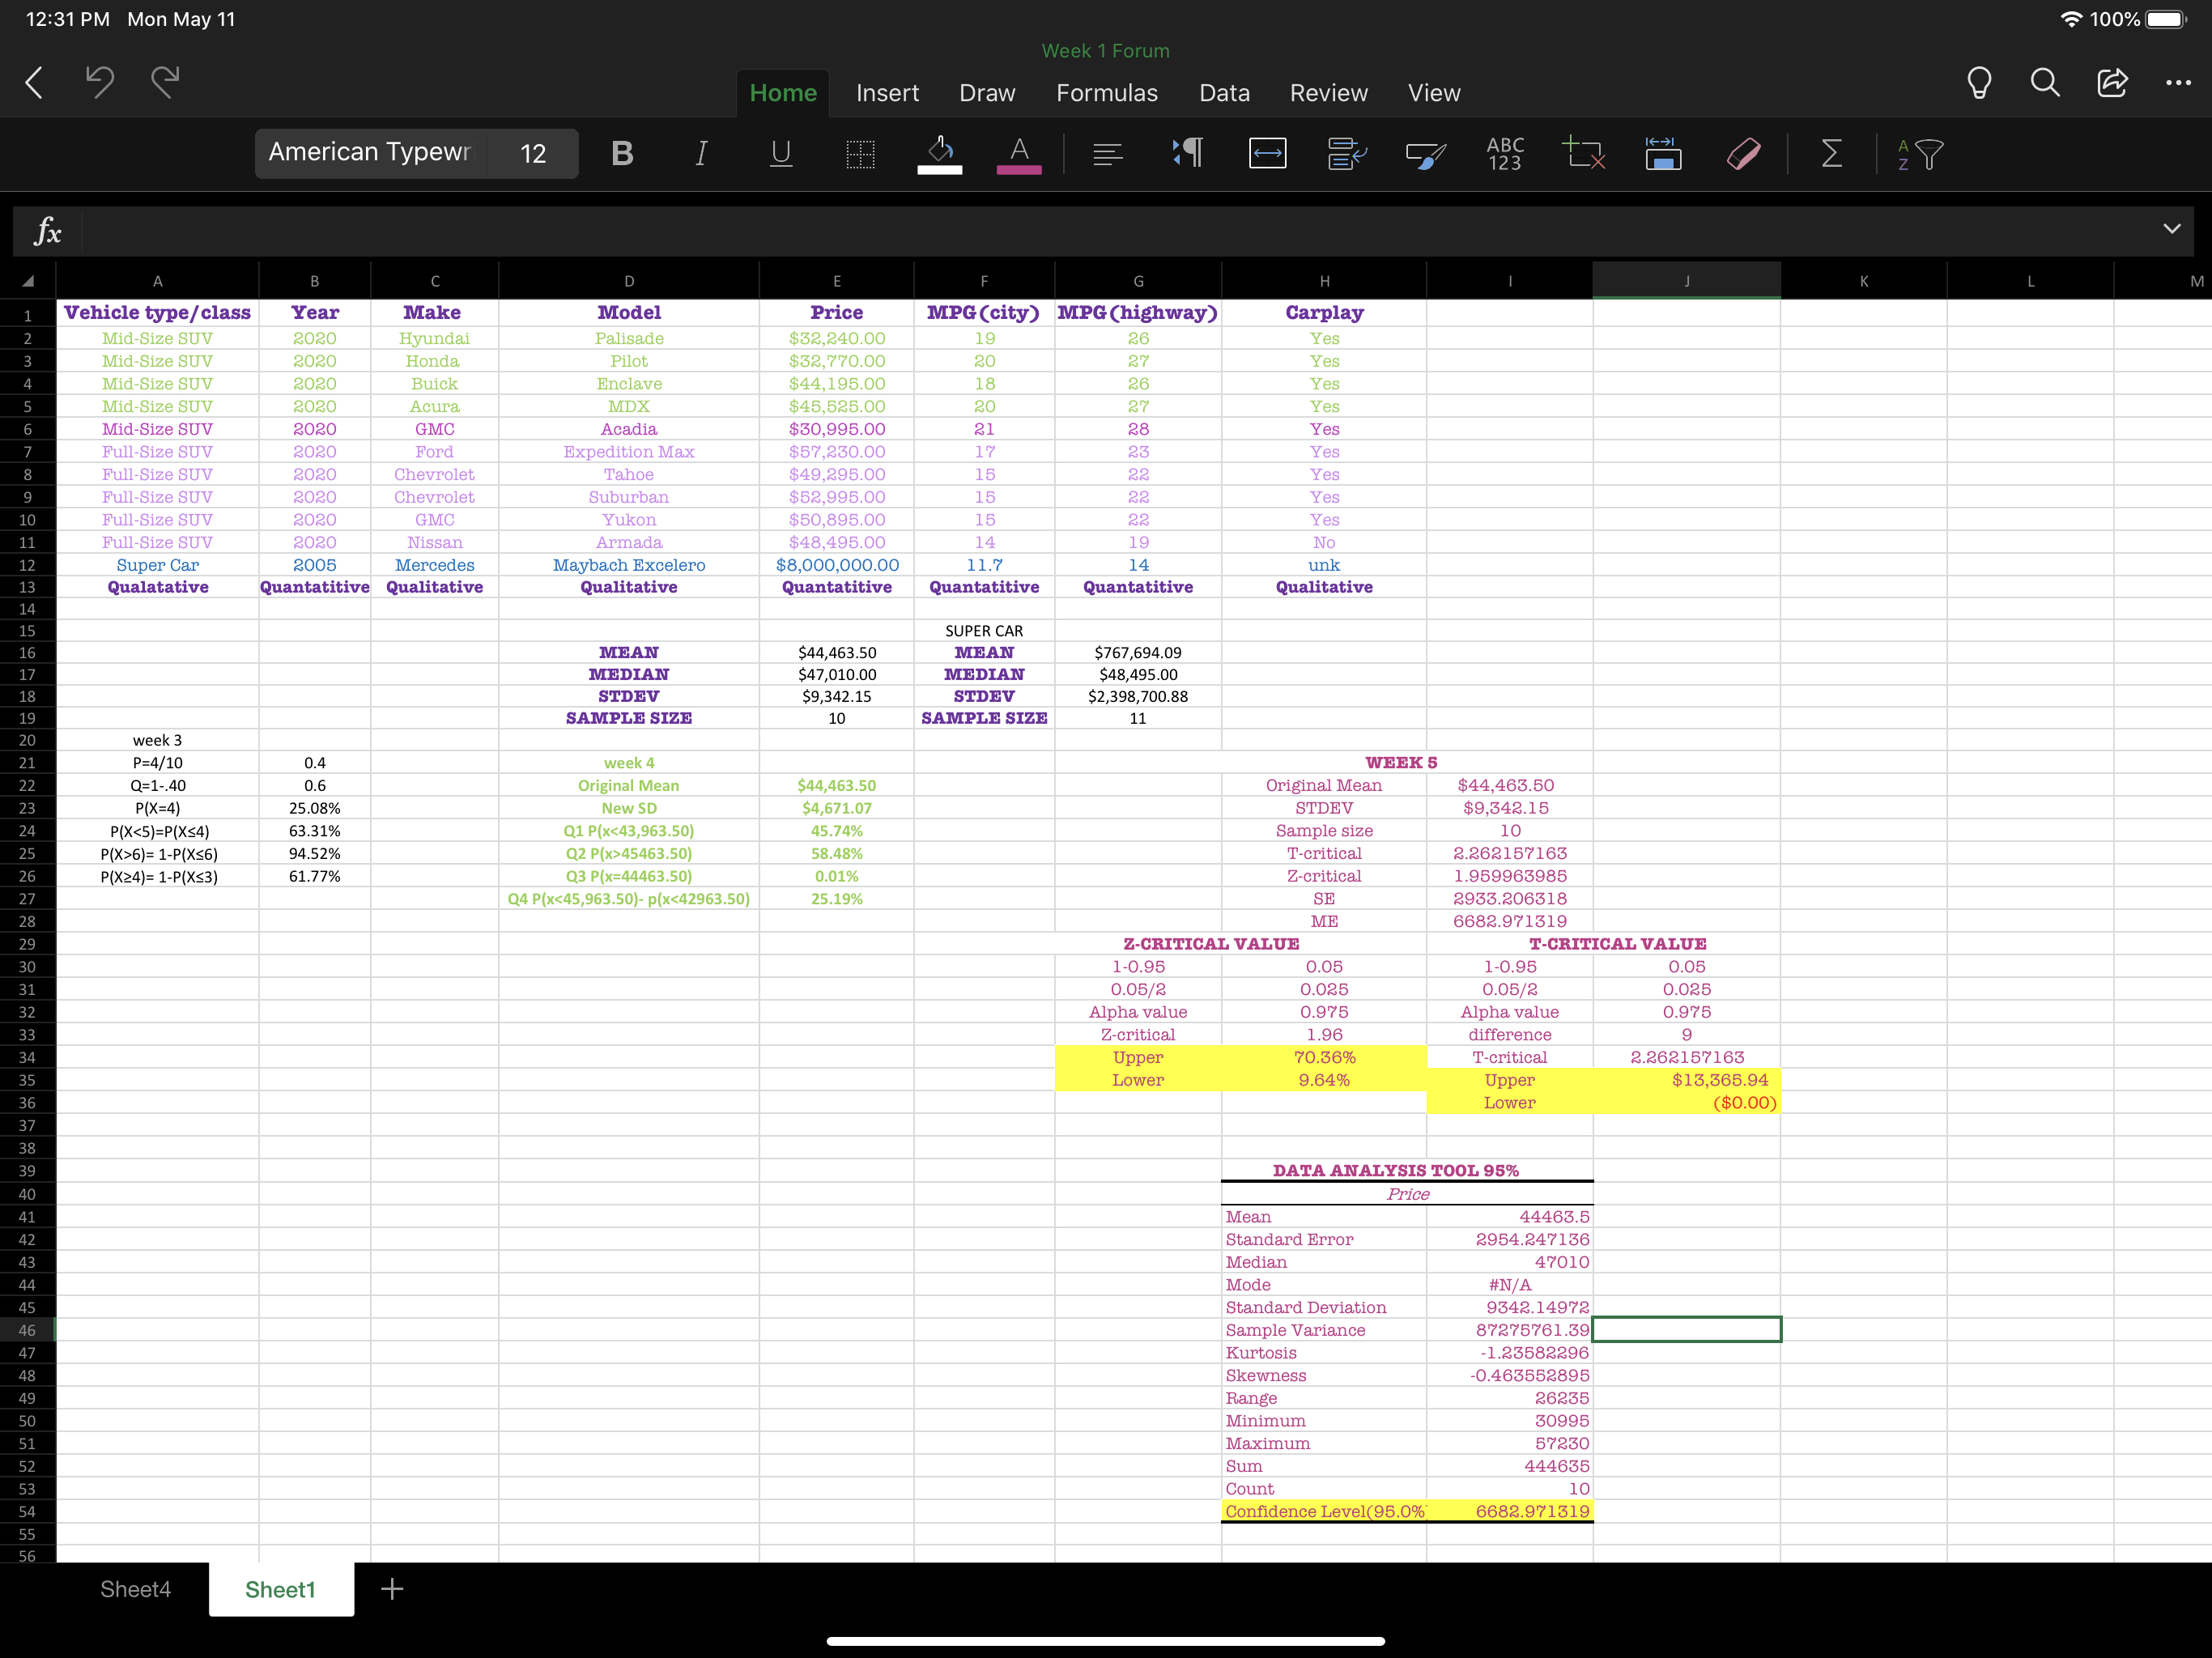
image text in transcribed
12:31 PM Mon May 11 100% Week 1 Forum Home Insert Draw Formulas Data Review View Q ... American Typewr 12 B I U A ABC 123 fx Vehicle type/ class Year Make Model Price MPG (city) MPG (highway) Carplay Mid-Size SUV 2020 Hyundai Palisade $32,240.00 19 26 Yes Mid-Size SUV 2020 Honda Pilot $32,770.00 20 27 Yes Mid-Size SUV 2020 Buick Enclave $44,195.00 18 26 Yes Mid-Size SUV 2020 Acura MDX $45,525.00 20 27 Yes Mid-Size SUV 2020 GMC Acadia $30,995.00 21 28 Yes Full-Size SUV 2020 Ford Expedition Max $57,230.00 17 23 Yes Full-Size SUV 2020 Chevrolet Tahoe $49,295.00 15 22 Yes Full-Size SUV 2020 Chevrolet Suburban $52,995.00 15 22 Yes Full-Size SUV 2020 GMC Yukon $50,895.00 15 22 Yes Full-Size SUV 2020 Nissan Armada $48,495.00 14 19 No Super Car 2005 Mercedes Maybach Excelero $8,000,000.00 11.7 14 unk Qualatative Quantatitive Qualitative Qualitative Quantatitive Quantatitive Quantatitive Qualitative SUPER CAR MEAN $44,463.50 MEAN $767,694.09 MEDIAN $47,010.00 MEDIA $48,495.00 STDEV $9,342.15 STDEV 2,398,700.88 SAMPLE SIZE 10 SAMPLE SIZE 11 week 3 P=4/10 0.4 week 4 WEEK 5 2=1-.40 0.6 Original Mean $44,463.50 Original Mean $44,463.50 P(X=4) 25.08% New SD $4,671.07 STDEV $9,342.15 P (X6)= 1-P(X56) 94.52% Q2 P(x>45463.50) 58.48% T-critical 2.262157163 P(X24)= 1-P(X

Step by Step Solution

There are 3 Steps involved in it

Step: 1

blur-text-image

Get Instant Access to Expert-Tailored Solutions

See step-by-step solutions with expert insights and AI powered tools for academic success

Step: 2

blur-text-image

Step: 3

blur-text-image

Ace Your Homework with AI

Get the answers you need in no time with our AI-driven, step-by-step assistance

Get Started

Recommended Textbook for

Quantitative Analysis For Management

Authors: Barry Render, Ralph M. Stair, Michael E. Hanna

11th Edition

9780132997621, 132149117, 132997622, 978-0132149112

Students also viewed these Mathematics questions