

Question
A travel agency made the table below to represent the profits it makes on a certain vacation package Number of People vs Profit Number of
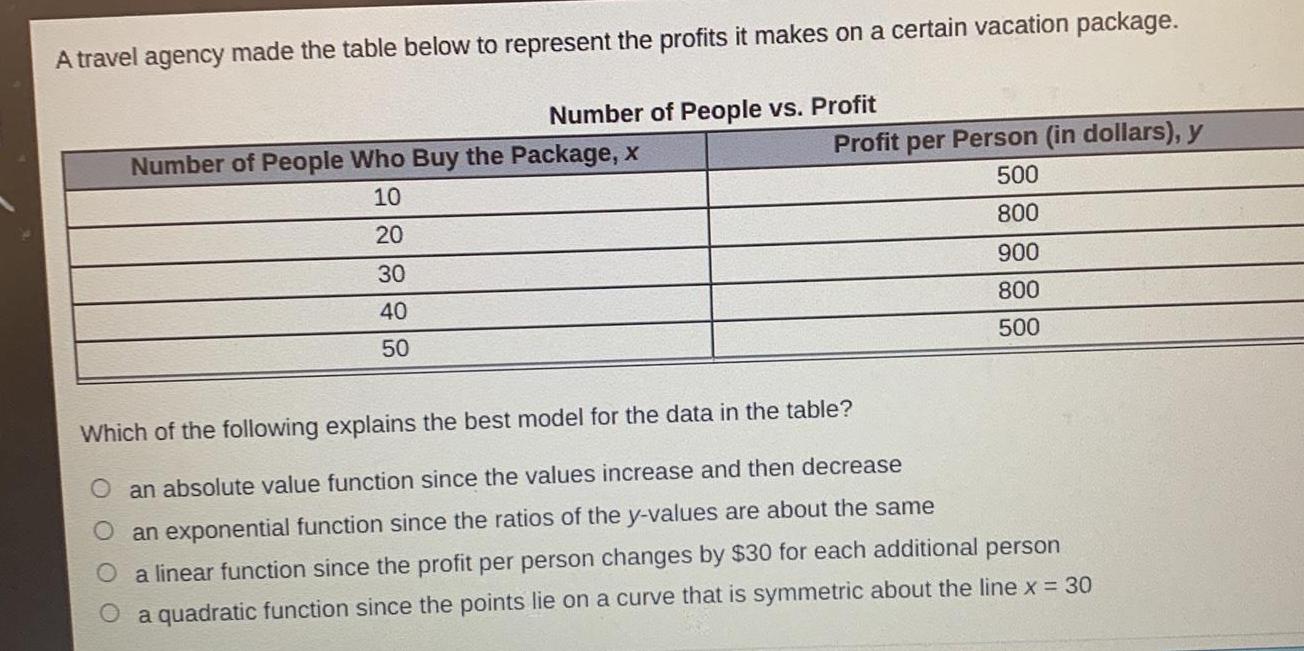

A travel agency made the table below to represent the profits it makes on a certain vacation package Number of People vs Profit Number of People Who Buy the Package x 10 20 30 40 50 Profit per Person in dollars y 500 800 900 800 500 Which of the following explains the best model for the data in the table O an absolute value function since the values increase and then decrease an exponential function since the ratios of the y values are about the same a linear function since the profit per person changes by 30 for each additional person a quadratic function since the points lie on a curve that is symmetric about the line x 30
Step by Step Solution
There are 3 Steps involved in it
Step: 1

Get Instant Access to Expert-Tailored Solutions
See step-by-step solutions with expert insights and AI powered tools for academic success
Step: 2

Step: 3
Ace Your Homework with AI
Get the answers you need in no time with our AI-driven, step-by-step assistance
Get Started
Discrete Mathematics Elementary And Beyond
Authors: L Lovasz, J Pelikan, K L Vesztergombi
1st Edition
6610010021, 9786610010028