Answered step by step
Verified Expert Solution
Question
1 Approved Answer
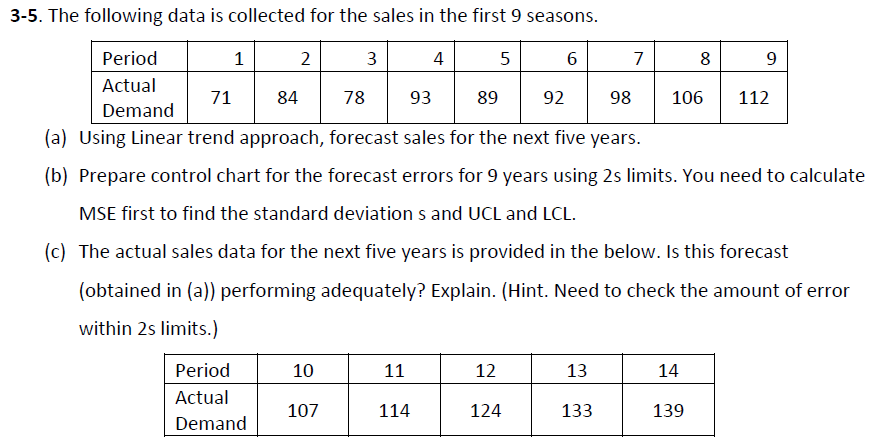
(a) Using Linear trend approach, forecast sales for the next five years. (b) Prepare control chart for the forecast errors for 9 years using 2s
 (a) Using Linear trend approach, forecast sales for the next five years. (b) Prepare control chart for the forecast errors for 9 years using 2s limits. You need to calculate MSE first to find the standard deviation s and UCL and LCL. (c) The actual sales data for the next five years is provided in the below. Is this forecast (obtained in (a)) performing adequately? Explain. (Hint. Need to check the amount of error within 2 s limits.)
 Step by Step Solution
There are 3 Steps involved in it
Step: 1

Get Instant Access to Expert-Tailored Solutions
See step-by-step solutions with expert insights and AI powered tools for academic success
Step: 2

Step: 3

Ace Your Homework with AI
Get the answers you need in no time with our AI-driven, step-by-step assistance
Get Started


