Answered step by step
Verified Expert Solution
Link Copied!

Question

1 Approved Answer

A. Using your graph from Part I, suppose you are interested in p for the most common category. State what p represents in context. B.
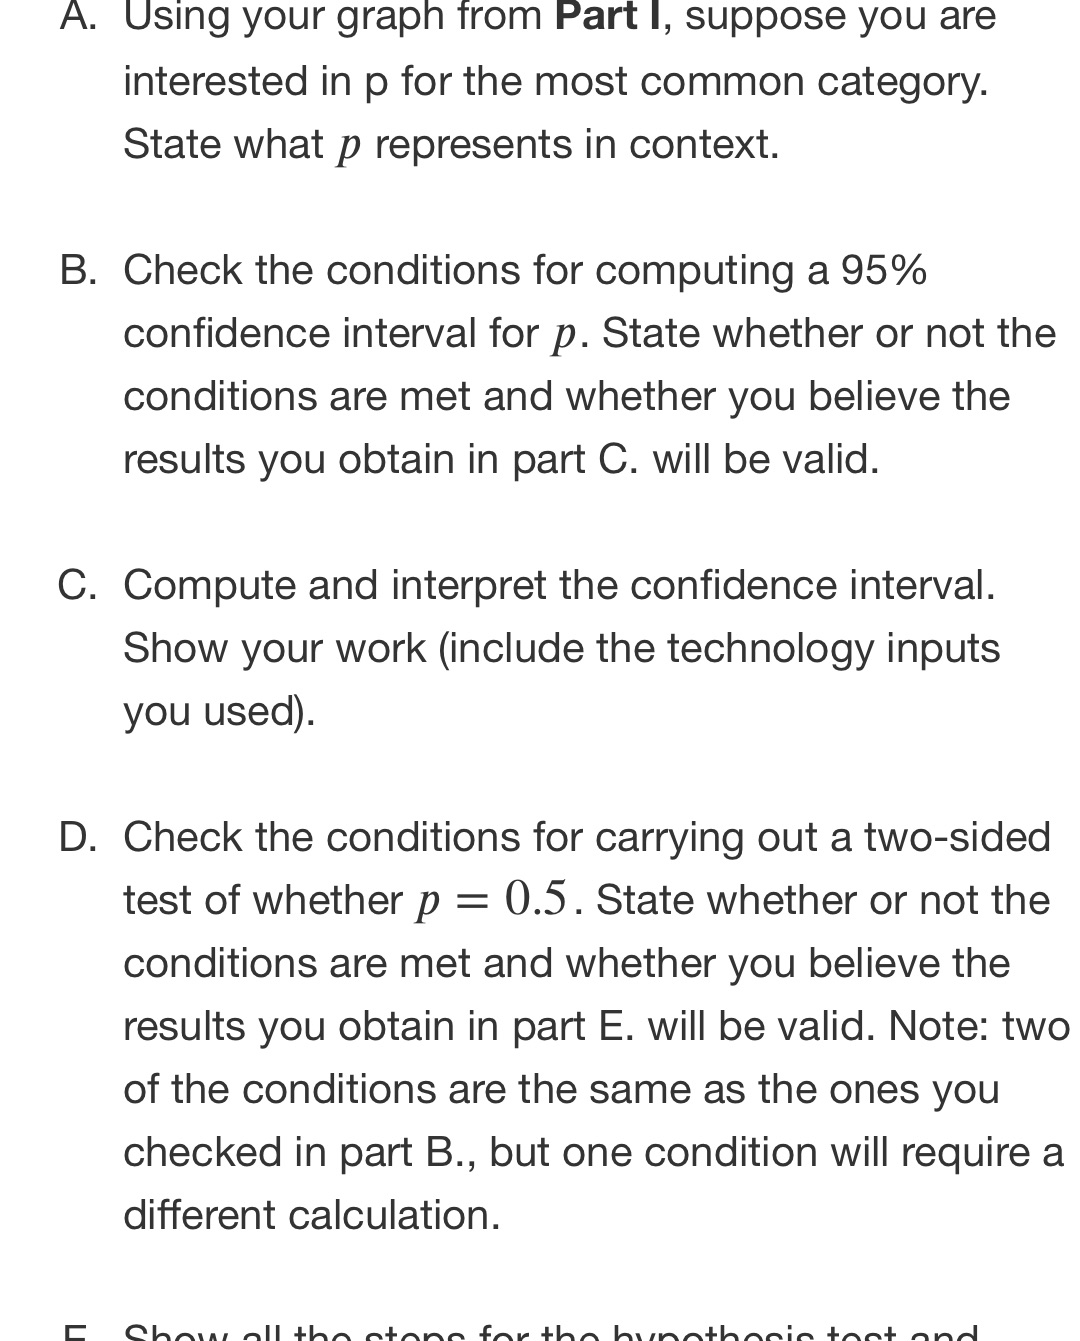
image text in transcribed
A. Using your graph from Part I, suppose you are interested in p for the most common category. State what p represents in context. B. Check the conditions for computing a 95% confidence interval for p. State whether or not the conditions are met and whether you believe the results you obtain in part C. will be valid. C. Compute and interpret the confidence interval. Show your work (include the technology inputs you used). D. Check the conditions for carrying out a two-sided test of whether p = 0.5. State whether or not the conditions are met and whether you believe the results you obtain in part E. will be valid. Note: two of the conditions are the same as the ones you checked in part B., but one condition will require a different calculation

Step by Step Solution

There are 3 Steps involved in it

Step: 1

blur-text-image

Get Instant Access to Expert-Tailored Solutions

See step-by-step solutions with expert insights and AI powered tools for academic success

Step: 2

blur-text-image

Step: 3

blur-text-image

Ace Your Homework with AI

Get the answers you need in no time with our AI-driven, step-by-step assistance

Get Started

Recommended Textbook for

Advanced Engineering Mathematics

Authors: ERWIN KREYSZIG

9th Edition

0471488852, 978-0471488859

More Books

Students also viewed these Mathematics questions

Question

answer fastly 9 3 0 .

Answered: 1 week ago

Question

What benefits are we looking to gain by using external providers?

Answered: 1 week ago