Question
A very successful and profitable firm is currently considering a new, large investment project that could be initiated at the start of 2021. The project
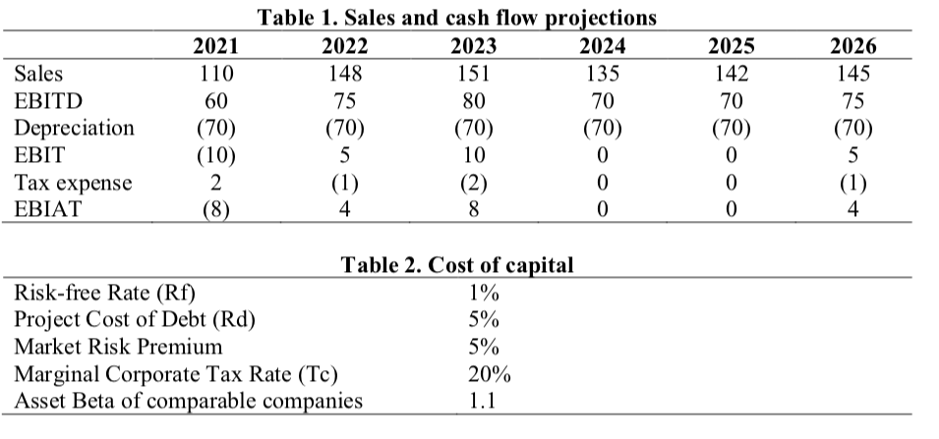
A very successful and profitable firm is currently considering a new, large investment project that could be initiated at the start of 2021. The project involves the acquisition of a plant, which requires an initial outlay of 420 million. Although it is not clear for how long the project will last, there is an expectation that over the first six years of the project its initial capital investment should be fully depreciated. The firms accountants have prepared the following projections on expected sales and cash flows, and information on the cost of capital of the company:

Carry out the following calculations, always assuming that cash flows occur at the end of their respective years:
(i) Estimate the NPV of the investment project at the start of 2021 if it is 100% financed with equity and assuming that the project is terminated at the end of 2026. Show and explain your calculations and comment on your findings.
(ii) Use the WACC method to estimate the NPV of the investment at the start of 2021 assuming that it is financed 55% with equity and 45% with debt and that the project is terminated at the end of 2026. Show and explain your calculations and comment
(iii) Calculate again the NPVs of parts (i) and (ii) by assuming that the project is not terminated in 2026 and that, instead, it is expected to produce the same cash flow (i.e. with zero future growth in cash flows) as that for the year 2026 in perpetuity. Show and explain your calculations and comment on your findings.
Sales EBITD Depreciation EBIT Tax expense EBIAT 2021 110 60 (70) (10) 2 (8) Table 1. Sales and cash flow projections 2022 2023 2024 148 151 135 75 80 70 (70) (70) (70) 5 10 0 (1) (2) 0 4 8 0 2025 142 70 (70) 0 0 0 2026 145 75 (70) 5 (1) 4 Table 2. Cost of capital Risk-free Rate (Rf) 1% Project Cost of Debt (Rd) 5% Market Risk Premium 5% Marginal Corporate Tax Rate (Tc) 20% Asset Beta of comparable companies 1.1 Sales EBITD Depreciation EBIT Tax expense EBIAT 2021 110 60 (70) (10) 2 (8) Table 1. Sales and cash flow projections 2022 2023 2024 148 151 135 75 80 70 (70) (70) (70) 5 10 0 (1) (2) 0 4 8 0 2025 142 70 (70) 0 0 0 2026 145 75 (70) 5 (1) 4 Table 2. Cost of capital Risk-free Rate (Rf) 1% Project Cost of Debt (Rd) 5% Market Risk Premium 5% Marginal Corporate Tax Rate (Tc) 20% Asset Beta of comparable companiesStep by Step Solution
There are 3 Steps involved in it
Step: 1

Get Instant Access to Expert-Tailored Solutions
See step-by-step solutions with expert insights and AI powered tools for academic success
Step: 2

Step: 3

Ace Your Homework with AI
Get the answers you need in no time with our AI-driven, step-by-step assistance
Get Started


