Question
A water bottling plant wants to analyze the percentage of defective bottles. The manager colleced 10 samples with 250 bottles in each sample. Based on
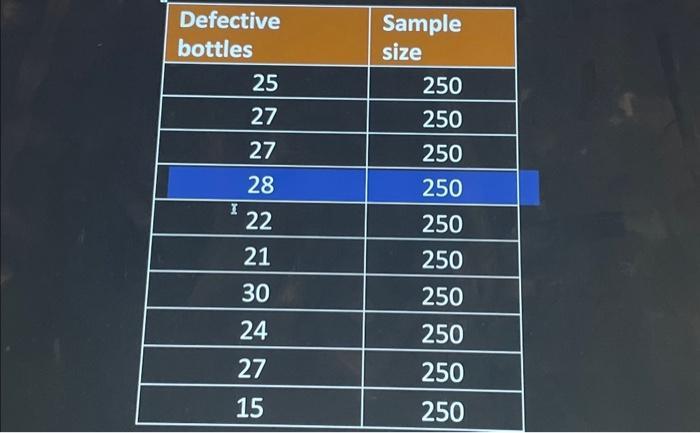
A water bottling plant wants to analyze the percentage of defective bottles. The manager colleced 10 samples with 250 bottles in each sample. Based on the given data, prepare the control chart for fractions defective bottles and determine whether the process is in statistical control. What can you conclude?
Defective bottles I 25 27 27 28 22 21 30 24 27 15 Sample size 250 250 250 250 250 250 250 250 250 250 Defective bottles I 25 27 27 28 22 21 30 24 27 15 Sample size 250 250 250 250 250 250 250 250 250 250
Step by Step Solution
3.48 Rating (158 Votes )
There are 3 Steps involved in it
Step: 1
To make a control graph for the small part of damaged bottles youll have to compute the negligible p...
Get Instant Access to Expert-Tailored Solutions
See step-by-step solutions with expert insights and AI powered tools for academic success
Step: 2

Step: 3

Ace Your Homework with AI
Get the answers you need in no time with our AI-driven, step-by-step assistance
Get StartedRecommended Textbook for
Applied Statistics And Probability For Engineers
Authors: Douglas C. Montgomery, George C. Runger
6th Edition
1118539710, 978-1118539712
Students also viewed these General Management questions
Question
Answered: 1 week ago
Question
Answered: 1 week ago
Question
Answered: 1 week ago
Question
Answered: 1 week ago
Question
Answered: 1 week ago
Question
Answered: 1 week ago
Question
Answered: 1 week ago
Question
Answered: 1 week ago
Question
Answered: 1 week ago
Question
Answered: 1 week ago
Question
Answered: 1 week ago
Question
Answered: 1 week ago
Question
Answered: 1 week ago
Question
Answered: 1 week ago
Question
Answered: 1 week ago
Question
Answered: 1 week ago
Question
Answered: 1 week ago
Question
Answered: 1 week ago
Question
Answered: 1 week ago
Question
Answered: 1 week ago
Question
Answered: 1 week ago
Question
Answered: 1 week ago
View Answer in SolutionInn App


