Answered step by step
Verified Expert Solution
Link Copied!

Question

1 Approved Answer

a. What percent of the staff owned Asian cars? b. What percent of Asian cars were owned by staff? c. Use a spreadsheet (like Google
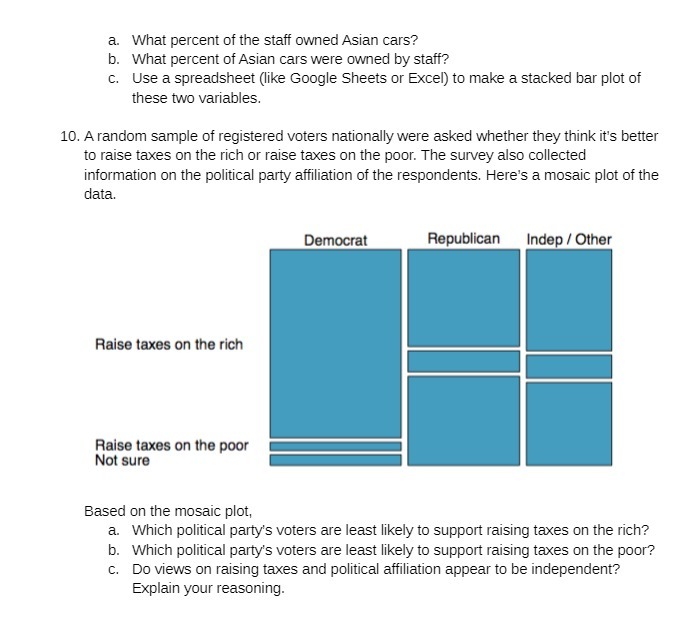
image text in transcribed
a. What percent of the staff owned Asian cars? b. What percent of Asian cars were owned by staff? c. Use a spreadsheet (like Google Sheets or Excel) to make a stacked bar plot of these two variables. 10. A random sample of registered voters nationally were asked whether they think it's better to raise taxes on the rich or raise taxes on the poor. The survey also collected information on the political party affiliation of the respondents. Here's a mosaic plot of the data. Democrat Republican Indep / Other Raise taxes on the rich Raise taxes on the poor Not sure Based on the mosaic plot, a. Which political party's voters are least likely to support raising taxes on the rich? b. Which political party's voters are least likely to support raising taxes on the poor? c. Do views on raising taxes and political affiliation appear to be independent? Explain your reasoning

Step by Step Solution

There are 3 Steps involved in it

Step: 1

blur-text-image

Get Instant Access to Expert-Tailored Solutions

See step-by-step solutions with expert insights and AI powered tools for academic success

Step: 2

blur-text-image

Step: 3

blur-text-image

Ace Your Homework with AI

Get the answers you need in no time with our AI-driven, step-by-step assistance

Get Started

Recommended Textbook for

College Algebra

Authors: Robert F Blitzer

7th Edition

013449492X, 9780134453262

More Books

Students also viewed these Mathematics questions

Question

2. Distinguish between data, facts, information, and knowledge.

Answered: 1 week ago