

Answered step by step
Verified Expert Solution
Question
1 Approved Answer
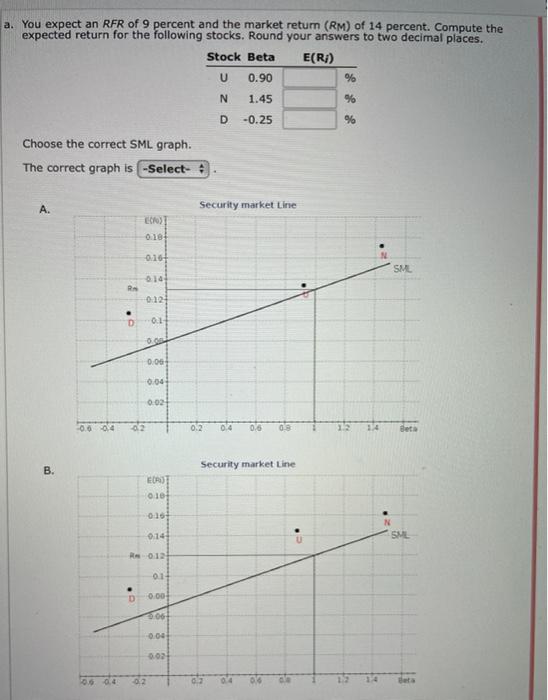
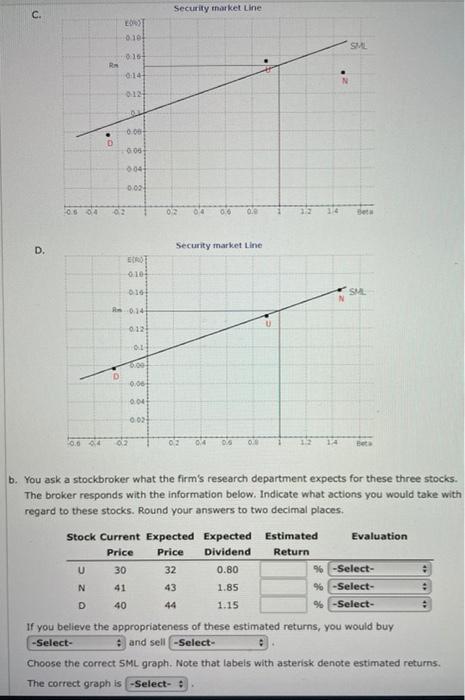
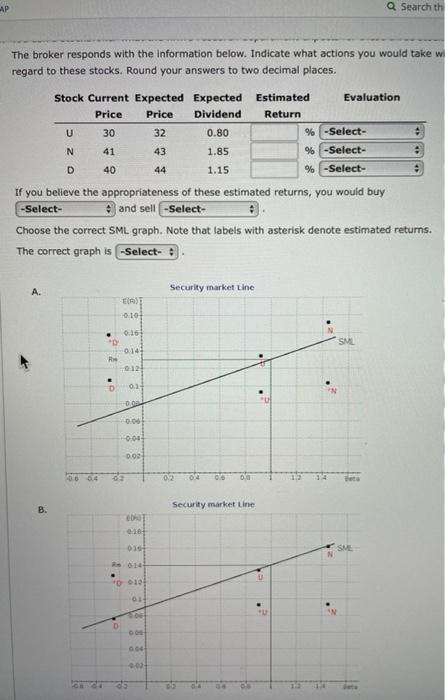
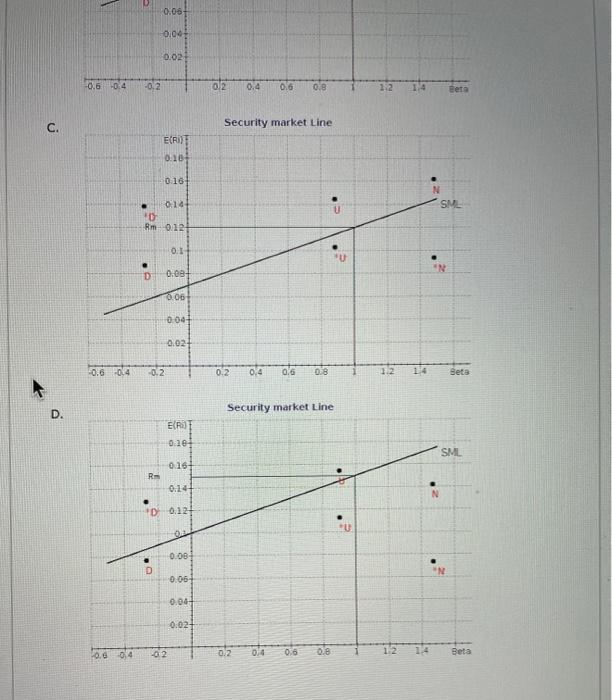
a. You expect an RFR of 9 percent and the market return (RM) of 14 percent. Compute the expected return for the following stocks. Round
Step by Step Solution
There are 3 Steps involved in it
Step: 1

Get Instant Access to Expert-Tailored Solutions
See step-by-step solutions with expert insights and AI powered tools for academic success
Step: 2

Step: 3
Ace Your Homework with AI
Get the answers you need in no time with our AI-driven, step-by-step assistance
Get Started
Dividend Policy On Share Price Volatility In Indian Stock Market
Authors: Vijay Deswal
1st Edition
3841859623, 978-3841859624