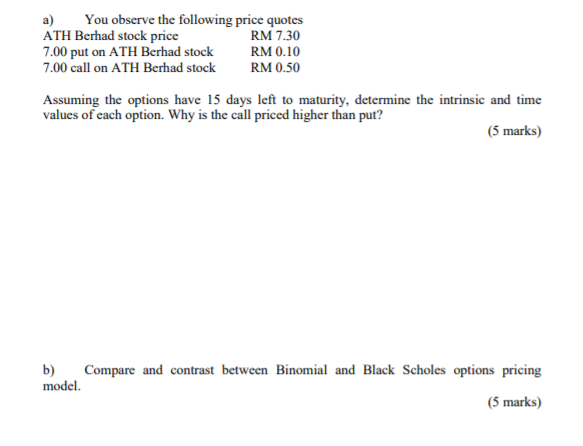
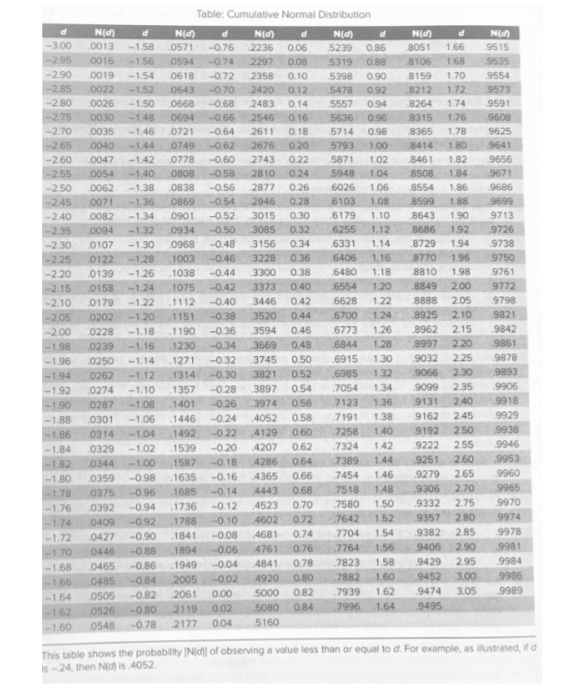
a) You observe the following price quotes ATH Berhad stock price RM 7.30 7.00 put on ATH Berhad stock RM 0.10 7.00 call on ATH Berhad stock RM 0.50 Assuming the options have 15 days left to maturity, determine the intrinsic and time values of each option. Why is the call priced higher than put? (5 marks) b) Compare and contrast between Binomial and Black Scholes options pricing model. (5 marks) d Nich 0013 0016 0019 0022 -3.00 -2.95 -2.90 -2.85 -2.80 -2.75 -2.70 -2.65 -260 -2.55 -2.50 -2.45 -2.40 -2.35 6406 -2.30 -225 -220 -2.15 -2.10 -205 -2.00 -1.98 -1.96 -1.94 -1.92 -1.90 -1.88 -1.86 -1.84 -1.82 -1.80 -1.78 -1.76 -1.74 -1.72 -1.70 -1.68 -1.66 -1.64 -1.62 - 160 0026 0030 0035 0040 .0047 0054 ,0062 0071 0082 0094 0107 0122 0139 0158 0179 0202 0228 0239 0250 0262 0274 0287 0301 0314 0329 0344 0359 0375 0392 0409 0427 0446 0465 0485 0505 0526 0548 Table: Cumulative Normal Distribution Nd d N() d N() d -1.58 0571 -0.76 2236 0.06 5239 0.86 -1.56 0594 -0.74 2297 0.08 5319 0.88 -1.54 0518 -0.72 2358 0.10 5398 0.90 -1.52 0643 -0.70 2420 0.12 5478 0.92 -1.50 0668 -0.68 2483 0.14 5557 0.94 -1.48 0694 -0.66 2546 0.16 5636 0.96 -1.46 0721 -0.64 2611 0.18 5714 0.98 -1.44 0749 -0.62 2676 0.20 5793 1.00 -1.42 0778 -0.60 2743 0.22 5871 1.02 -1.40 0808 -0.58 2810 0.24 5948 104 - 1.38 0838 -0.56 2877 0.26 6026 1.06 -1.36 0869 -0.54 2946 0.28 6103 1.08 -1.34 0901 -0.52 3015 0.30 6179 1.10 -1.32 0934 -0.50 3085 0.32 6255 1.12 -1.30 0968 -0.48 3156 0.34 6331 1.14 -1.28 1003 -0.46 3228 0.36 1.16 -1.26 1038 -0.44 3300 0.38 6480 1.18 -1.24 1075 -0.42 3373 0.40 6554 1.20 - 1.22 1112 -0.40 3446 0.42 6628 1.22 -1.20 1151 -0.38 3520 0.44 6700 1.24 -1.18 1190 -0.36 3594 0.46 .6773 1.26 -1.16 1230 -0.34 3669 0.48 6844 1.28 -1.14 1271 -0.32 3745 0.50 .6915 1.30 -1.12 1314 -0.30 3821 0.52 6985 1.32 -1.10 1357 -0.28 3897 0.54 7054 1.34 - 1.08 1401 -0.26 3974 0.56 7123 1.36 -1.06 1446 -0.24 4052 0.58 7191 1.38 - 1.04 1492 -0.22 .4129 0.50 7258 1.40 - 102 .1539 -0.20 4207 0.62 .7324 1.42 -1.00 1587 -0.18 4286 0.64 7389 -0.98 .1635 -0.16 4365 0.66 7454 1.46 -0.96 1685 -0.14 4443 0.68 7518 1.48 -0.94 1736 -0.12 4523 0.70 7580 1.50 -0.92 1788 -0.10 4602 0.72 .7642 1.52 -0.90 1841 -0.08 4681 0.74 7704 1.54 -0.88 1894 -0.06 4761 0.76 7764 1.56 -0.86 .1949 -0.04 4841 0.78 7823 1.58 -0.84 2005 -0.02 4920 0.80 7882 1.60 -0.82 2061 0.00 5000 0.82 .7939 1.62 -0.80 2119 0.02 0.84 7996 1.64 -0.78 2177 0.04 5160 Nd 8051 8106 8159 8212 8264 8315 8365 8414 8461 8508 8554 8599 8643 8686 8729 8770 8810 8849 8888 8925 8962 8997 9032 9066 9099 9131 9162 9192 9222 9251 9279 9306 9332 9357 9382 9406 9429 9452 9474 9495 1.66 1.68 1.70 1.72 1.74 1.76 1.78 1.80 1.82 1.84 1.86 1.88 1.90 1.92 1.94 1.96 1.98 2.00 2.05 2.10 2.15 2.20 2.25 2.30 2.35 2.40 2.45 2.50 2.55 2.60 2.65 2.70 2.75 280 2.85 2.90 2.95 3.00 3.05 NE 9515 9535 9554 9573 9591 9608 9625 9641 9656 9671 9686 9699 9713 9726 9738 9750 9761 9772 9798 9821 9842 9861 9878 9893 9906 9918 9929 9938 9946 9953 9960 9965 9970 9974 9978 9981 9984 9986 9989 5080 This table shows the probability of observing a value less than or equal to d. For example, as illustrated, if d -24, then Nid) is 4052 a) You observe the following price quotes ATH Berhad stock price RM 7.30 7.00 put on ATH Berhad stock RM 0.10 7.00 call on ATH Berhad stock RM 0.50 Assuming the options have 15 days left to maturity, determine the intrinsic and time values of each option. Why is the call priced higher than put? (5 marks) b) Compare and contrast between Binomial and Black Scholes options pricing model. (5 marks) d Nich 0013 0016 0019 0022 -3.00 -2.95 -2.90 -2.85 -2.80 -2.75 -2.70 -2.65 -260 -2.55 -2.50 -2.45 -2.40 -2.35 6406 -2.30 -225 -220 -2.15 -2.10 -205 -2.00 -1.98 -1.96 -1.94 -1.92 -1.90 -1.88 -1.86 -1.84 -1.82 -1.80 -1.78 -1.76 -1.74 -1.72 -1.70 -1.68 -1.66 -1.64 -1.62 - 160 0026 0030 0035 0040 .0047 0054 ,0062 0071 0082 0094 0107 0122 0139 0158 0179 0202 0228 0239 0250 0262 0274 0287 0301 0314 0329 0344 0359 0375 0392 0409 0427 0446 0465 0485 0505 0526 0548 Table: Cumulative Normal Distribution Nd d N() d N() d -1.58 0571 -0.76 2236 0.06 5239 0.86 -1.56 0594 -0.74 2297 0.08 5319 0.88 -1.54 0518 -0.72 2358 0.10 5398 0.90 -1.52 0643 -0.70 2420 0.12 5478 0.92 -1.50 0668 -0.68 2483 0.14 5557 0.94 -1.48 0694 -0.66 2546 0.16 5636 0.96 -1.46 0721 -0.64 2611 0.18 5714 0.98 -1.44 0749 -0.62 2676 0.20 5793 1.00 -1.42 0778 -0.60 2743 0.22 5871 1.02 -1.40 0808 -0.58 2810 0.24 5948 104 - 1.38 0838 -0.56 2877 0.26 6026 1.06 -1.36 0869 -0.54 2946 0.28 6103 1.08 -1.34 0901 -0.52 3015 0.30 6179 1.10 -1.32 0934 -0.50 3085 0.32 6255 1.12 -1.30 0968 -0.48 3156 0.34 6331 1.14 -1.28 1003 -0.46 3228 0.36 1.16 -1.26 1038 -0.44 3300 0.38 6480 1.18 -1.24 1075 -0.42 3373 0.40 6554 1.20 - 1.22 1112 -0.40 3446 0.42 6628 1.22 -1.20 1151 -0.38 3520 0.44 6700 1.24 -1.18 1190 -0.36 3594 0.46 .6773 1.26 -1.16 1230 -0.34 3669 0.48 6844 1.28 -1.14 1271 -0.32 3745 0.50 .6915 1.30 -1.12 1314 -0.30 3821 0.52 6985 1.32 -1.10 1357 -0.28 3897 0.54 7054 1.34 - 1.08 1401 -0.26 3974 0.56 7123 1.36 -1.06 1446 -0.24 4052 0.58 7191 1.38 - 1.04 1492 -0.22 .4129 0.50 7258 1.40 - 102 .1539 -0.20 4207 0.62 .7324 1.42 -1.00 1587 -0.18 4286 0.64 7389 -0.98 .1635 -0.16 4365 0.66 7454 1.46 -0.96 1685 -0.14 4443 0.68 7518 1.48 -0.94 1736 -0.12 4523 0.70 7580 1.50 -0.92 1788 -0.10 4602 0.72 .7642 1.52 -0.90 1841 -0.08 4681 0.74 7704 1.54 -0.88 1894 -0.06 4761 0.76 7764 1.56 -0.86 .1949 -0.04 4841 0.78 7823 1.58 -0.84 2005 -0.02 4920 0.80 7882 1.60 -0.82 2061 0.00 5000 0.82 .7939 1.62 -0.80 2119 0.02 0.84 7996 1.64 -0.78 2177 0.04 5160 Nd 8051 8106 8159 8212 8264 8315 8365 8414 8461 8508 8554 8599 8643 8686 8729 8770 8810 8849 8888 8925 8962 8997 9032 9066 9099 9131 9162 9192 9222 9251 9279 9306 9332 9357 9382 9406 9429 9452 9474 9495 1.66 1.68 1.70 1.72 1.74 1.76 1.78 1.80 1.82 1.84 1.86 1.88 1.90 1.92 1.94 1.96 1.98 2.00 2.05 2.10 2.15 2.20 2.25 2.30 2.35 2.40 2.45 2.50 2.55 2.60 2.65 2.70 2.75 280 2.85 2.90 2.95 3.00 3.05 NE 9515 9535 9554 9573 9591 9608 9625 9641 9656 9671 9686 9699 9713 9726 9738 9750 9761 9772 9798 9821 9842 9861 9878 9893 9906 9918 9929 9938 9946 9953 9960 9965 9970 9974 9978 9981 9984 9986 9989 5080 This table shows the probability of observing a value less than or equal to d. For example, as illustrated, if d -24, then Nid) is 4052