

Question: A1 Xfx =Round(('Part A_Data File CVP'! A B D E 2 1 3 4 5 ASSUMPTIONS Product: Sports drink Selling price per unit Total Variable
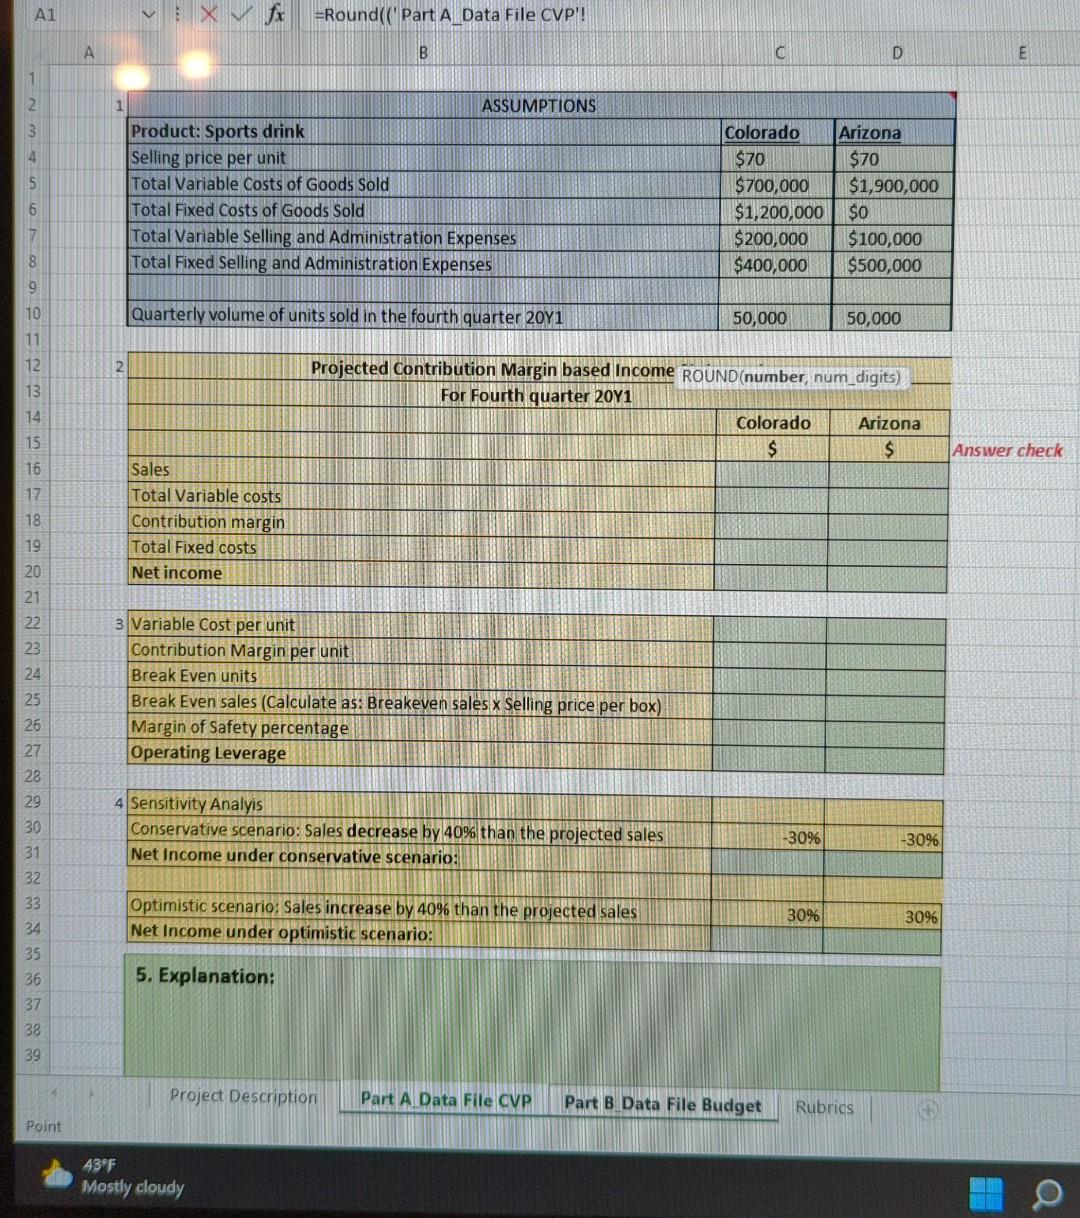
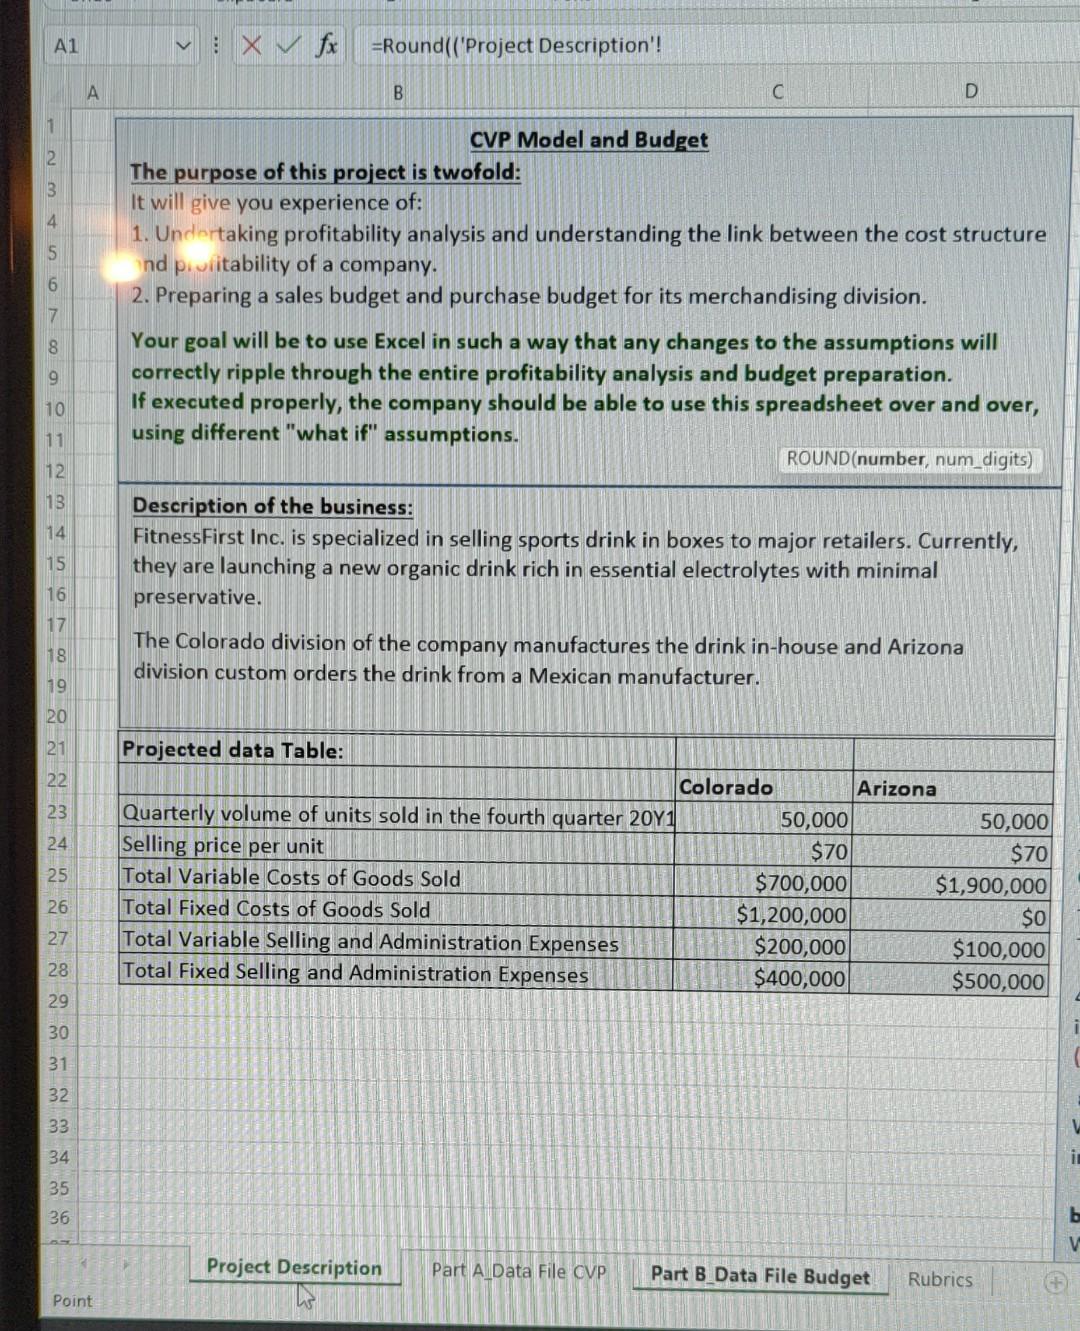
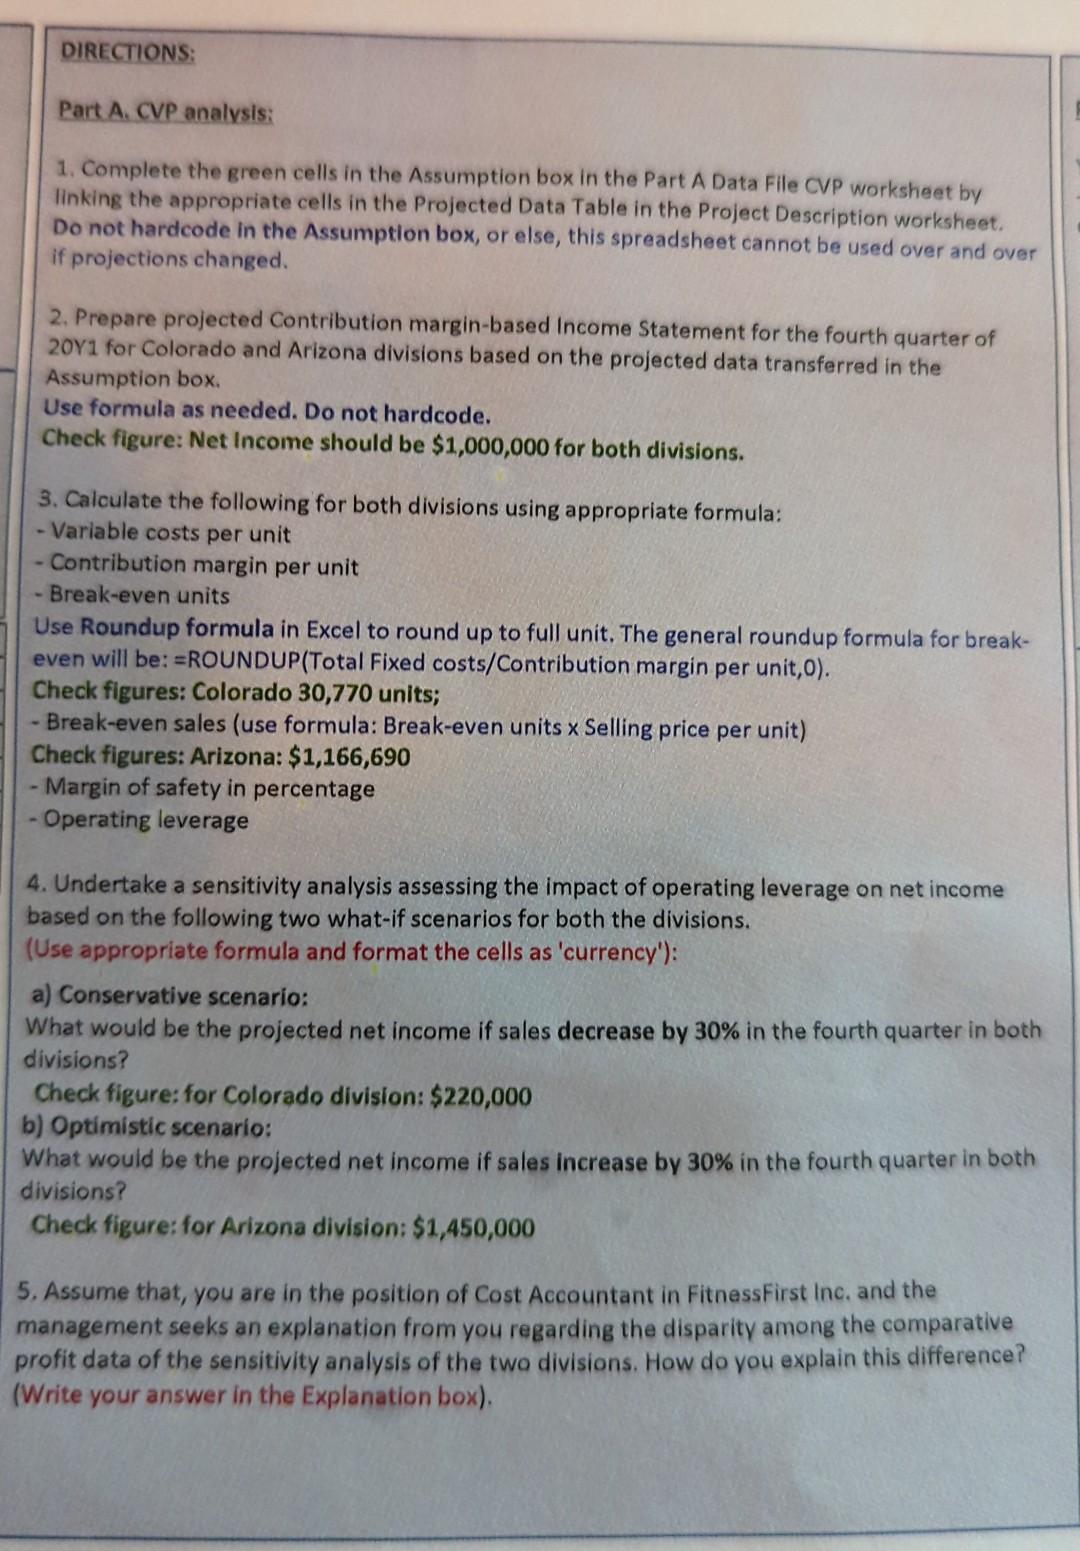
A1 Xfx =Round(('Part A_Data File CVP'! A B D E 2 1 3 4 5 ASSUMPTIONS Product: Sports drink Selling price per unit Total Variable costs of Goods Sold Total Fixed Costs of Goods Sold Total Variable Selling and Administration Expenses Total Fixed Selling and Administration Expenses Colorado $70 $700,000 $1,200,000 $200,000 $400,000 6 Arizona $70 $1,900,000 $0 $100,000 $500,000 7 8 9 10 Quarterly volume of units sold in the fourth quarter 2041 50,000 50,000 11 12 2 13 14 15 Projected Contribution Margin based Income ROUND(number, num_digits) For Fourth quarter 2011 Colorado Arizona $ $ Answer check 16 17 18 19 20 Sales Total Variable costs Contribution margin Total Fixed costs Net income 21 22 23 24 3 Variable Cost per unit Contribution Margin per unit Break Even units Break Even sales (Calculate as: Breakeven sales x Selling price per box) Margin of Safety percentage Operating Leverage 25 26 27 28 29 30 4 Sensitivity Analyis Conservative scenario: Sales decrease by 40% than the projected sales Net Income under conservative scenario: -30% -30% Optimistic scenario: Sales increase by 40% than the projected sales Net Income under optimistic scenario: 30% 30% 31 32 33 34 35 36 37 38 39 5. Explanation: Project Description Part A Data File CVP Part B Data File Budget Rubrics Point 43F Mostly cloudy Al : XV fx =Round(('Project Description'! A B C D 2 3 4 5 6 CVP Model and Budget The purpose of this project is twofold: It will give you experience of: 1. Undertaking profitability analysis and understanding the link between the cost structure ind pi viitability of a company. 2. Preparing a sales budget and purchase budget for its merchandising division. Your goal will be to use Excel in such a way that any changes to the assumptions will correctly ripple through the entire profitability analysis and budget preparation. If executed properly, the company should be able to use this spreadsheet over and over, using different "what if" assumptions. ROUND(number, num_digits) 7 8 9 10 11 12 13 14 Description of the business: Fitness First Inc. is specialized in selling sports drink in boxes to major retailers. Currently, they are launching a new organic drink rich in essential electrolytes with minimal preservative. 15 16 17 The Colorado division of the company manufactures the drink in-house and Arizona division custom orders the drink from a Mexican manufacturer. 18 19 20 21 22 23 24 25 Projected data Table: Colorado Arizona Quarterly volume of units sold in the fourth quarter 2011 50,000 50,000 Selling price per unit $70 $70 Total Variable Costs of Goods Sold $700,000 $1,900,000 Total Fixed Costs of Goods Sold $1,200,000 $0 Total Variable Selling and Administration Expenses $200,000 $100,000 Total Fixed Selling and Administration Expenses $400,000 $500,000 26 27 28 29 30 31 32 33 V 34 i 35 36 b V Project Description Part A Data File CVP Part B Data File Budget Rubrics Point DIRECTIONS: Part A. CVP analysis: 1. Complete the green cells in the Assumption box in the Part A Data File CVP worksheet by linking the appropriate cells in the Projected Data Table in the Project Description worksheet. Do not hardcode in the Assumption box, or else, this spreadsheet cannot be used over and over if projections changed. 2. Prepare projected Contribution margin-based Income Statement for the fourth quarter of 2011 for Colorado and Arizona divisions based on the projected data transferred in the Assumption box. Use formula as needed. Do not hardcode. Check figure: Net Income should be $1,000,000 for both divisions. 3. Calculate the following for both divisions using appropriate formula: - Variable costs per unit - Contribution margin per unit - Break-even units Use Roundup formula in Excel to round up to full unit. The general roundup formula for break- even will be: =ROUNDUP(Total Fixed costs/Contribution margin per unit,0). Check figures: Colorado 30,770 units; - Break-even sales (use formula: Break-even units x Selling price per unit) Check figures: Arizona: $1,166,690 - Margin of safety in percentage - Operating leverage 4. Undertake a sensitivity analysis assessing the impact of operating leverage on net income based on the following two what-if scenarios for both the divisions. (Use appropriate formula and format the cells as 'currency"): a) Conservative scenario: What would be the projected net income if sales decrease by 30% in the fourth quarter in both divisions? Check figure: for Colorado division: $220,000 b) Optimistic scenario: What would be the projected net income if sales increase by 30% in the fourth quarter in both divisions? Check figure: for Arizona division: $1,450,000 5. Assume that, you are in the position of Cost Accountant in Fitness First Inc. and the management seeks an explanation from you regarding the disparity among the comparative profit data of the sensitivity analysis of the two divisions. How do you explain this difference? (Write your answer in the Explanation box)
Step by Step Solution
There are 3 Steps involved in it

Get step-by-step solutions from verified subject matter experts