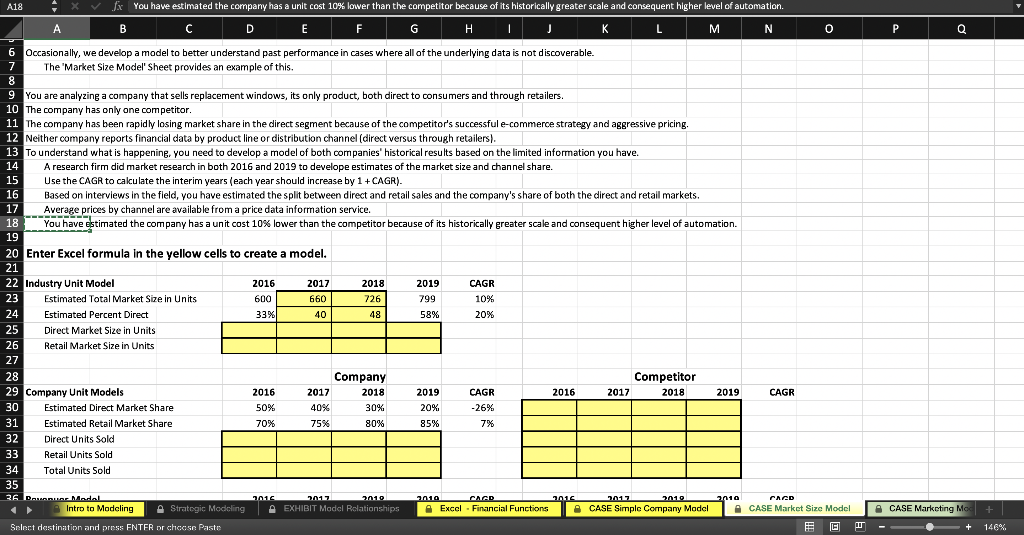
A18 . x fx B You have estimated the company has a unit cost 10% lower than the competitor because of its historically greater scale and consequent higher level of automation C D E F G H I J K L N M | 6 7 Occasionally, we develop a model to better understand past performance in cases where all of the underlying data is not discoverable. The Market Size Model Sheet provides an example of this. 9 You are analyzing a company that sells replacement windows, its only product, both direct to consumers and through retailers. 10 The company has only one competitor. 11 The company has been rapidly losing market share in the direct segment because of the competitor's successful e-commerce strategy and aggressive pricing. 12 Neither company reports financial data by product line or distribution channel (direct versus through retailers). 13 To understand what is happenine, you need to develop a model of both companies' historical results based on the limited information you have. A research firm did market research in both 2016 and 2019 to develope estimates of the market size and channel share. 15 Use the CAGR to cakulate the interim years (each year should increase by 1 +CAGR). 16 Based on interviews in the field, you have estimated the split between direct and retail sales and the company's share of both the direct and retail markets. 17 Average prices by channel are available from a price data information service. You have estimated the company has a unit cost 10% lower than the competitor because of its historically greater scale and consequent higher level of automation. 18 20 Enter Excel formula in the yellow cells to create a model. 22 Industry Unit Model 23 Estimated Total Market Size in Units Estimated Percent Direct 25 Direct Market Size in Units 26 Retail Market Size in Units 2016 600 33% 2017 660 40 2018 726 48 2019 799 58% CAGR 10% 20% 24 Competitor 2018 CAGR 2016 2017 2019 CAGR 2016 50% 28 29 Company Unit Models Estimated Direct Market Share Estimated Retail Market Share Direct Units Sold Retail Units Sold 34 Total Units Sold Company 2017 2018 40% 30% 75% 80% 2019 20% 85% -26% 70% 7% 35 36 B L Modal Intro to Modeling Strategic Modeling Select destination and press ENTER or choose Paste dealing Team EXHIBM Model Response 2010 Exco A EXHIBIT Model Relationships Excel - Financial Functions | CASE Simple Company Model CASE Market Size Model C OCASE Marketing Mod - - + + 146%


