Question
a-2) Number of observation a-3) customer proportion spent money on amazon prime b-2) frequency vs bin graph Question: Amazon Prime is a $119-per-year service that

a-2) Number of observation
a-3) customer proportion spent money on amazon prime  b-2) frequency vs bin graph
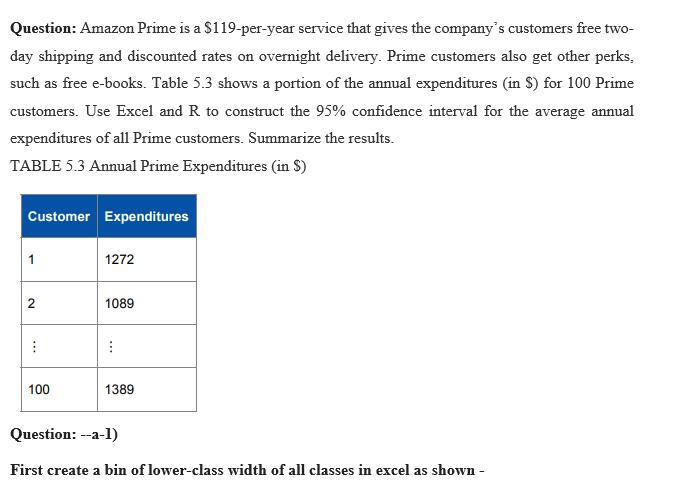
Question: Amazon Prime is a $119-per-year service that gives the company's customers free two- day shipping and discounted rates on overnight delivery. Prime customers also get other perks. such as free e-books. Table 5.3 shows a portion of the annual expenditures (in $) for 100 Prime customers. Use Excel and R to construct the 95% confidence interval for the average annual expenditures of all Prime customers. Summarize the results. TABLE 5.3 Annual Prime Expenditures (in $) Customer Expenditures 2 ..... 100 1272 1089 1389 Question: --a-1) First create a bin of lower-class width of all classes in excel as shown -
Step by Step Solution
There are 3 Steps involved in it
Step: 1

Get Instant Access to Expert-Tailored Solutions
See step-by-step solutions with expert insights and AI powered tools for academic success
Step: 2

Step: 3

Ace Your Homework with AI
Get the answers you need in no time with our AI-driven, step-by-step assistance
Get StartedRecommended Textbook for
Data Analysis And Decision Making
Authors: Christian Albright, Wayne Winston, Christopher Zappe
4th Edition
538476125, 978-0538476126
Students also viewed these Accounting questions
Question
Answered: 1 week ago
Question
Answered: 1 week ago
Question
Answered: 1 week ago
Question
Answered: 1 week ago
Question
Answered: 1 week ago
Question
Answered: 1 week ago
Question
Answered: 1 week ago
Question
Answered: 1 week ago
Question
Answered: 1 week ago
Question
Answered: 1 week ago
Question
Answered: 1 week ago
Question
Answered: 1 week ago
Question
Answered: 1 week ago
Question
Answered: 1 week ago
Question
Answered: 1 week ago
Question
Answered: 1 week ago
Question
Answered: 1 week ago
Question
Answered: 1 week ago
Question
Answered: 1 week ago
Question
Answered: 1 week ago
Question
Answered: 1 week ago
Question
Answered: 1 week ago
View Answer in SolutionInn App


