Answered step by step
Verified Expert Solution
Link Copied!

Question

1 Approved Answer

A.3. The following table shows the expected returns from investing in assets A and B in three possible future scenarios (S=1,S=2 and S=3), as well

image text in transcribed

A.3. The following table shows the expected returns from investing in assets A and B in three possible future scenarios (S=1,S=2 and S=3), as well as the probabilities of each scenario occurring. (a) At a glance, which asset seems to offer a higher return? Which seems more risky? (b) Compute the expected return of each asset and the variance and standard deviation of the returns and compare the estimates to your expectations. (c) If the risk free asset in this economy offers a 2% rate of return, which is the expected return of a portfolio that invests 50% in A and 50% in B. (d) Compute the expected return of a portfolio with 30% invested in asset A, 40% invested in asset B and the remainder invested in the risk-free asset. (e) Compute the risk (standard deviation) of the previous portfolios

Step by Step Solution

There are 3 Steps involved in it

Step: 1

blur-text-image

Get Instant Access to Expert-Tailored Solutions

See step-by-step solutions with expert insights and AI powered tools for academic success

Step: 2

blur-text-image

Step: 3

blur-text-image

Ace Your Homework with AI

Get the answers you need in no time with our AI-driven, step-by-step assistance

Get Started

Recommended Textbook for

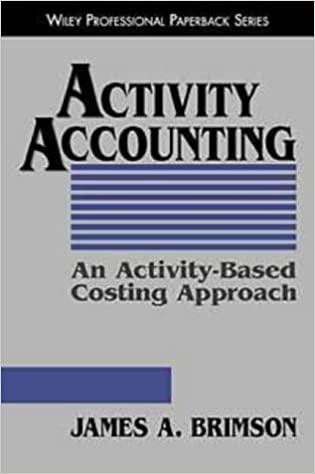
Activity Accounting An Activity-Based Costing Approach

Authors: James A. Brimson

1st Edition

0471196282, 978-0471196280

More Books

Students also viewed these Accounting questions