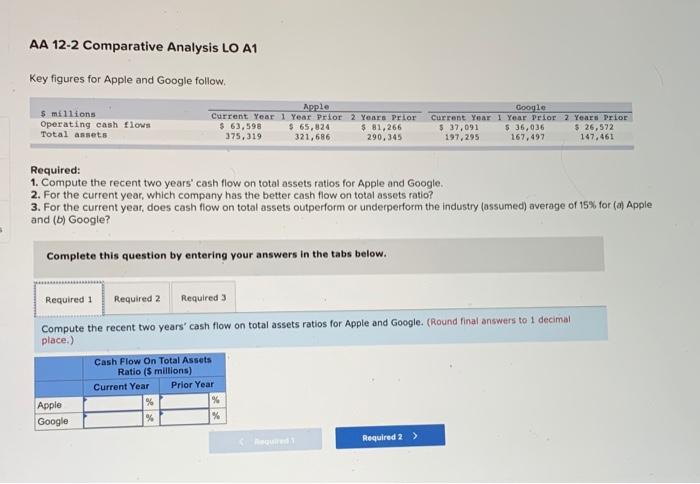
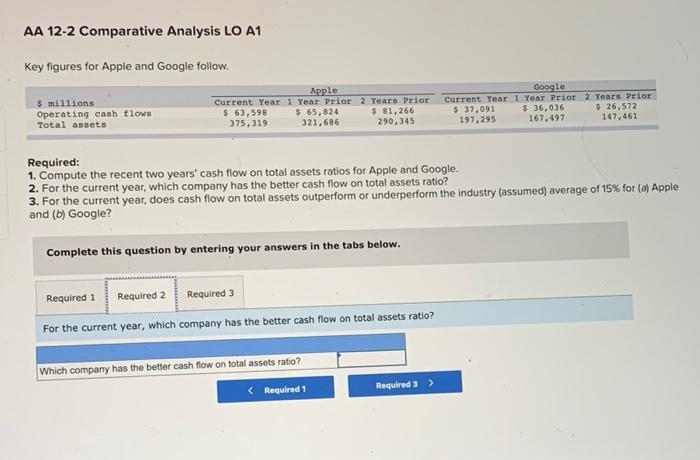
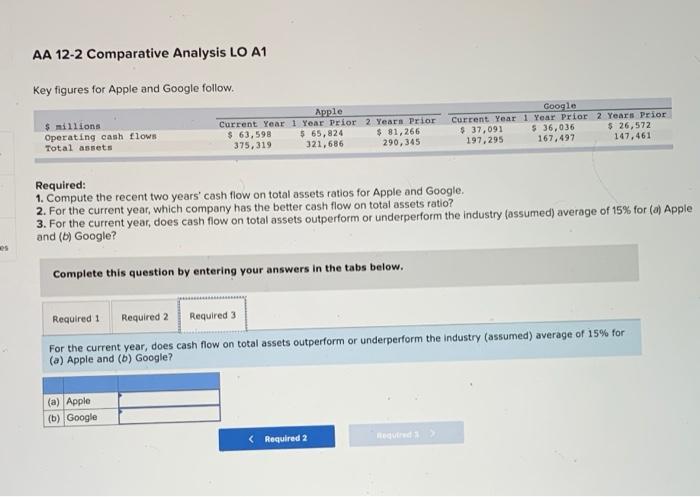
AA 12-2 Comparative Analysis LO A1 Key figures for Apple and Google follow $ millions Operating cash flows Total assets Apple Current Year 1 Year Prior 2 Years Prior $ 63,598 $ 65,024 $ 81,266 375,319 321,686 290.345 Google Current YOAY 1 Year Prior 2 YEARS Prior $ 37,091 5 36,036 $ 26,572 197,295 167,497 147.461 Required: 1. Compute the recent two years' cash flow on total assets ratios for Apple and Google. 2. For the current year, which company has the better cash flow on total assets ratio? 3. For the current year, does cash flow on total assets outperform or underperform the industry (assumed) average of 15% for ( Apple and (6) Google? Complete this question by entering your answers in the tabs below. Required 1 Required 2 Required Compute the recent two years' cash flow on total assets ratios for Apple and Google. (Round final answers to 1 decimal place.) Cash Flow On Total Assets Ratio (5 millions) Current Year Prior Year % Google Required 2 > Apple AA 12-2 Comparative Analysis LO A1 Key figures for Apple and Google follow, $ millions Operating cash flows Total assets Apple Current Year 1 Year Prior 2 Years Prior $ 63,598 $ 65,824 $ 81,266 375,319 321,686 290,345 Google Current Year 1 Year Prior 2 Years Prior $ 37,091 $ 36,036 $ 26,572 197.295 167.497 147,461 Required: 1. Compute the recent two years' cash flow on total assets ratios for Apple and Google. 2. For the current year, which company has the better cash flow on total assets ratio? 3. For the current year, does cash flow on total assets outperform or underperform the industry (assumed) average of 15% for (a) Apple and (b) Google? Complete this question by entering your answers in the tabs below. Required 1 Required 2 Required 3 For the current year, which company has the better cash flow on total assets ratio? Which company has the better cash flow on total assets ratio? AA 12-2 Comparative Analysis LO A1 Key figures for Apple and Google follow. $ millions Operating cash flows Total assets Apple Current Year 1 Year Prior 2 Years Prior $ 63,598 5 65,824 $ 81,266 375,319 321, 686 290,345 Google Current Year 1 Year Prior 2 Years Prior $ 37,091 $36,036 $ 26,572 197,295 167.497 147.461 Required: 1. Compute the recent two years' cash flow on total assets ratios for Apple and Google, 2. For the current year, which company has the better cash flow on total assets ratio? 3. For the current year, does cash flow on total assets outperform or underperform the industry (assumed) average of 15% for (a) Apple and (6) Google? Complete this question by entering your answers in the tabs below. Required 1 Required 2 Required 3 For the current year, does cash flow on total assets outperform or underperform the Industry (assumed) average of 15% for (a) Apple and (b) Google? (a) Apple (b) Google