

Question
about study time and exam score has data as shown on the scatter plot The least squares line was also graphed and the equation is

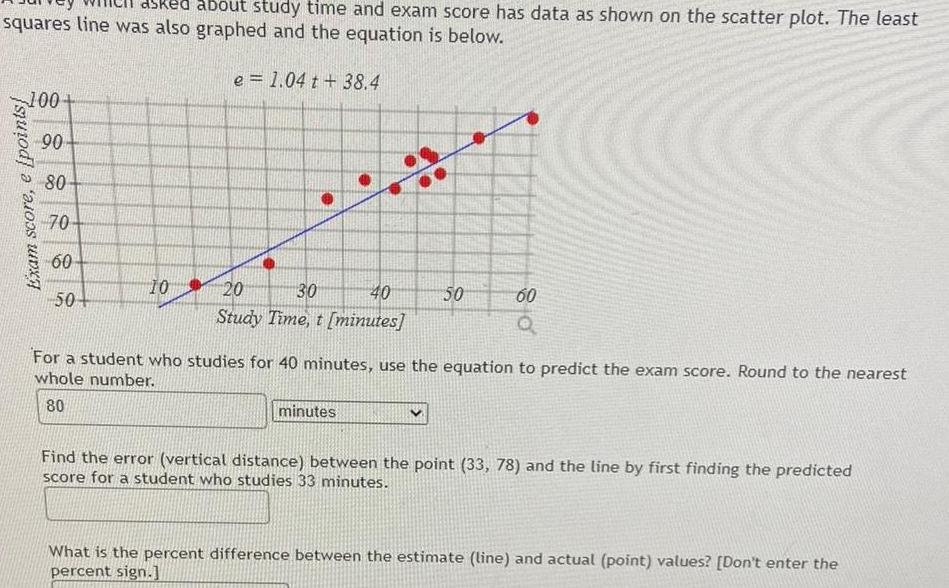
about study time and exam score has data as shown on the scatter plot The least squares line was also graphed and the equation is below e 1 04 t 38 4 100 points Exam score e 90 80 70 60 50 10 20 40 30 Study Time t minutes 50 minutes 60 Q For a student who studies for 40 minutes use the equation to predict the exam score Round to the nearest whole number 80 Find the error vertical distance between the point 33 78 and the line by first finding the predicted score for a student who studies 33 minutes What is the percent difference between the estimate line and actual point values Don t enter the percent sign
Step by Step Solution
There are 3 Steps involved in it
Step: 1

Get Instant Access to Expert-Tailored Solutions
See step-by-step solutions with expert insights and AI powered tools for academic success
Step: 2

Step: 3
Ace Your Homework with AI
Get the answers you need in no time with our AI-driven, step-by-step assistance
Get Started
Textbook Of Co-ordinate Geometry
Authors: Mofidul Islam
1st Edition
9353147824, 9789353147822