Question
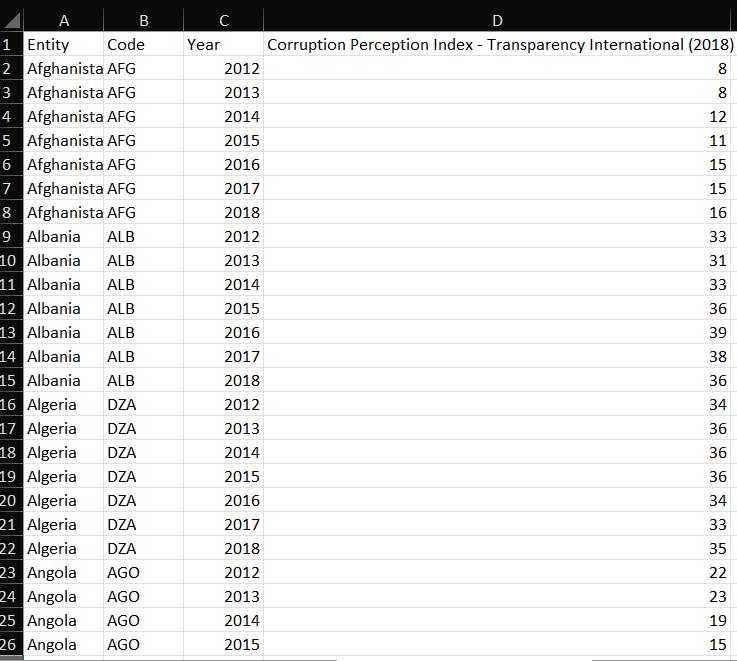
Abstract all the data from the table using excel formula (cannot do it manually), form a new table that only contain the countries (refer to


Abstract all the data from the table using excel formula (cannot do it manually), form a new table that only contain the countries (refer to the question) , 2015 year and Corruption Perception Index - Transparency International (2018).
The country and year for that country is sorted.
The data set for Corruption Perception Index scores and Human Development Index is available in Corruption VS HDI xls. i) Construct a diagram for the Corruption Perception Index scores for the year 2015 for Denmark, New Zealand, Finland, Singapore, Sweden, Somalia, Syria, South Sudan, Yemen, and North Korea.
Step by Step Solution
3.61 Rating (166 Votes )
There are 3 Steps involved in it
Step: 1
Entity Denmark DNK New Zealand NZL Finland FIN Singapore SGP Sweden SWE Somalia SOM ...
Get Instant Access to Expert-Tailored Solutions
See step-by-step solutions with expert insights and AI powered tools for academic success
Step: 2

Step: 3

Ace Your Homework with AI
Get the answers you need in no time with our AI-driven, step-by-step assistance
Get StartedRecommended Textbook for
Statistical Reasoning For Everyday Life
Authors: Jeff Bennett, William Briggs, Mario Triola
5th Edition
9780134494043
Students also viewed these General Management questions
Question
Answered: 1 week ago
Question
Answered: 1 week ago
Question
Answered: 1 week ago
Question
Answered: 1 week ago
Question
Answered: 1 week ago
Question
Answered: 1 week ago
Question
Answered: 1 week ago
Question
Answered: 1 week ago
Question
Answered: 1 week ago
Question
Answered: 1 week ago
Question
Answered: 1 week ago
Question
Answered: 1 week ago
Question
Answered: 1 week ago
Question
Answered: 1 week ago
Question
Answered: 1 week ago
Question
Answered: 1 week ago
Question
Answered: 1 week ago
Question
Answered: 1 week ago
Question
Answered: 1 week ago
Question
Answered: 1 week ago
Question
Answered: 1 week ago
View Answer in SolutionInn App


