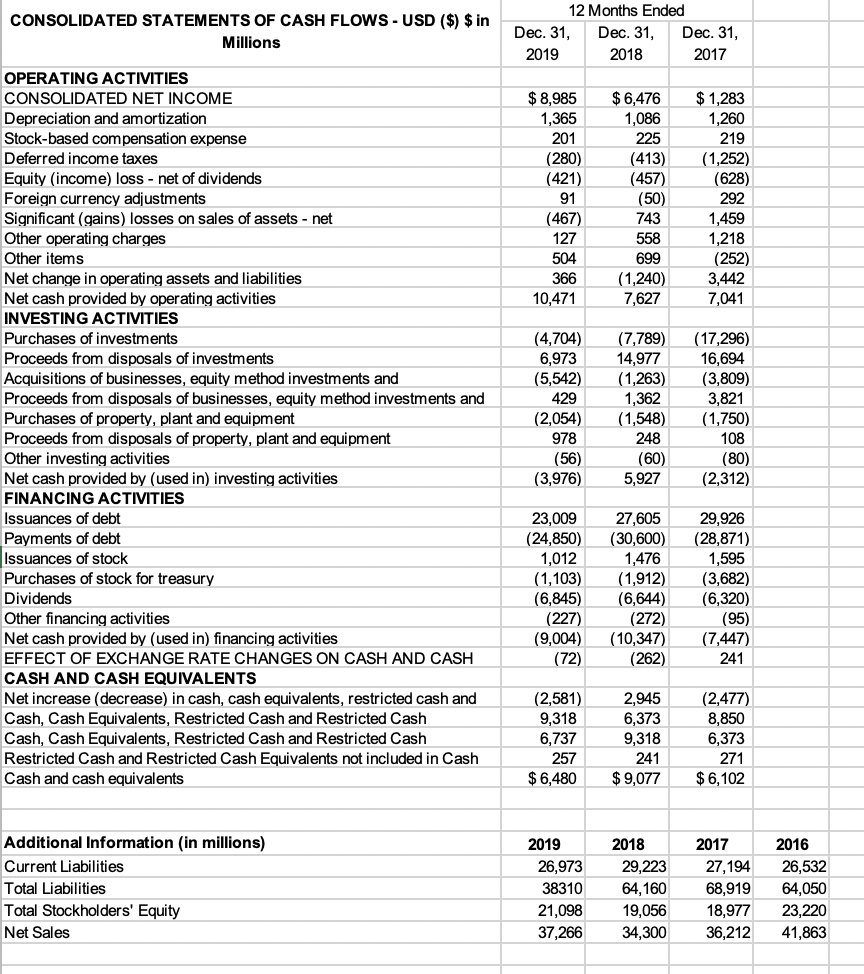
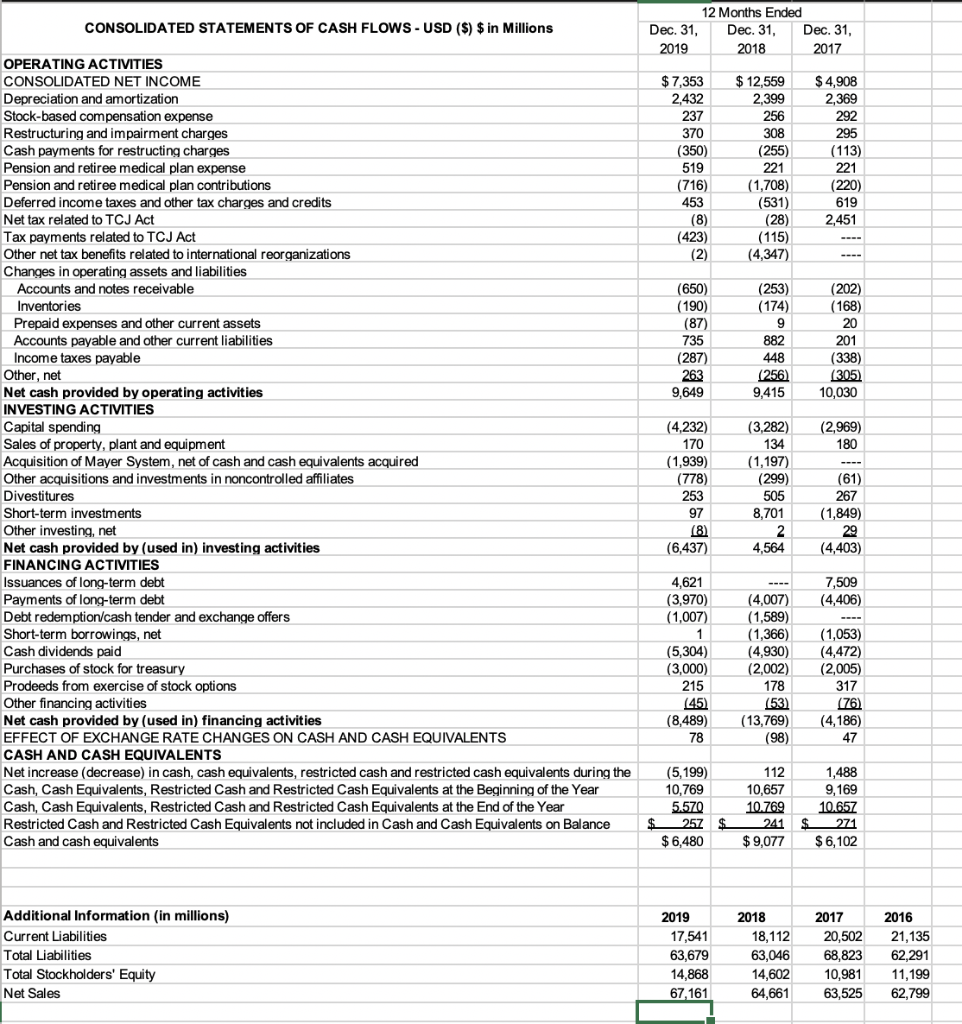
AC 313 Intermediate Accounting III, Spring 2021 Excel Project III Statement of Cash Flow Learning Objectives 1. Analyze statement of cash flows 2. Calculate key financial ratios 3. Interpret key financial ratios 4. Produce professional Excel worksheet 5. Hone professional writing The purpose of a statement of cash flows is to provide relevant information about a company's cash inflows and outflows for a period that assists investors and creditors in projecting the company's future cash flows. Also, users of the financial statements compute key financial ratios to evaluate and compare companies. The following are key financial ratios computed with information presented on the statement of cash flows: Current cash debt coverage measures whether a company can pay its current debts with cash provided from operating activities (Liquidity). A company's liquidity is dependent its ability to general additional cash to cover debt payments. Net cash provided by operating activities Average current liabilities Cash debt coverage measures a company's ability to pay debts with cash provided from operating activities (Solvency). Net cash provided by operating activities Average total liabilities Cash return on sales (Profitability) Net cash provided by operating activities Net sales Free cash flow measures the discretionary cash that a company has to invest in long-term assets, to retire debt, or to make distributions to shareholders. The amount of free cash is considered available for discretionary purposes such as debt reduction or new investment purchases (Flexibility). Net cash provided by operating activities-Capital expenditures-Cash dividends=Free Cash Flow AC 313 Intermediate Accounting III, Spring 2021 The statement of cash flows for Company A and Company B are presented in the data set file. Also, additional information for each company is provided to use to complete the following requirements. Requirements: 1. On a separate worksheet create a schedule for each company summarizing the net cash provided by activities over the three-year period. Label the worksheet ActivitiesSum. On the worksheet display the summary in a clustered column chart for each company. Place the cluster column chart next the schedule of each company. 2. Based on the statement of cash flow and the outcome of the summary, answer the following questions for each company. Provide evidence for your conclusions. Place your conclusion below the summary schedules and clustered column charts. a. Is the cash provided by operating activities increasing or decreasing over the three-year period? b. Are either or both Company A and Company B expanding its business or contracting its business as evidenced by the investing activities? c. Have Company A and Company B increasing or decreasing its long-term debt over the three-year period? d. What is the most notable financing activity reported for Company A and Company B over the three-year period? What was the amount of cash received or paid for that activity each year? 3. On a separate worksheet create a schedule for each company to present the key financial ratios for the three-year period. Label the worksheet SCFRatios. (Use formulas above to calculate ratios). What pattern do you detect for each company over the three-year period? What conclusions concerning the management of cash of each company can be drawn from the ratios computed? Include in your description the liquidity, solvency, and profitability aspect. In your view which company has a strong cash position? Support your view with reference to evidence. Place answers in cell below ratio calculations. 4. The worksheets should be formatted with appropriate numeric values using accounting format with zero decimals. Financial ratios should be carried out two decimal places. Also, you should include proper titles on worksheets and charts, and display in a professional style. 5. Use cell referencing and appropriate formulas in creating worksheets. Excel Project III Due: 5/9/2021 via Blackboard CONSOLIDATED STATEMENTS OF CASH FLOWS - USD ($) $ in Millions 12 Months Ended Dec. 31, Dec. 31, Dec. 31, 2019 2018 2017 $ 8,985 1,365 201 (280) (421) 91 (467) 127 504 366 10,471 $ 6,476 1,086 225 (413) (457) (50) 743 558 699 (1,240) 7,627 $ 1,283 1,260 219 (1,252) (628) 292 1,459 1,218 (252) 3,442 7,041 OPERATING ACTIVITIES CONSOLIDATED NET INCOME Depreciation and amortization Stock-based compensation expense Deferred income taxes Equity (income) loss - net of dividends Foreign currency adjustments Significant (gains) losses on sales of assets - net Other operating charges Other items Net change in operating assets and liabilities Net cash provided by operating activities INVESTING ACTIVITIES Purchases of investments Proceeds from disposals of investments Acquisitions of businesses, equity method investments and Proceeds from disposals of businesses, equity method investments and Purchases of property, plant and equipment Proceeds from disposals of property, plant and equipment Other investing activities Net cash provided by (used in) investing activities FINANCING ACTIVITIES Issuances of debt Payments of debt Issuances of stock Purchases of stock for treasury Dividends Other financing activities Net cash provided by (used in) financing activities EFFECT OF EXCHANGE RATE CHANGES ON CASH AND CASH CASH AND CASH EQUIVALENTS Net increase (decrease) in cash, cash equivalents, restricted cash and Cash, Cash Equivalents, Restricted Cash and Restricted Cash Cash, Cash Equivalents, Restricted Cash and Restricted Cash Restricted Cash and Restricted Cash Equivalents not included in Cash Cash and cash equivalents (4,704) 6,973 (5,542) 429 (2,054) 978 (56) (3,976) (7,789) 14,977 (1,263) 1,362 (1,548) 248 (60) 5,927 (17,296) 16,694 (3,809) 3,821 (1,750) 108 (80) (2,312) 23,009 (24,850) 1,012 (1,103) (6,845) (227) (9,004) (72) 27,605 (30,600) 1,476 (1,912) (6,644) (272) (10,347) (262) 29,926 (28,871) 1,595 (3,682) (6,320) (95) (7,447) 241 (2,581) 9,318 6,737 257 $ 6,480 2,945 6,373 9,318 241 $ 9,077 (2,477) 8,850 6,373 271 $ 6,102 Additional Information (in millions) Current Liabilities Total Liabilities Total Stockholders' Equity Net Sales 2019 26,973 38310 21,098 37,266 2018 29,223 64,160 19,056 34,300 2017 27,194 68,919 18,977 36,212 2016 26,532 64,050 23,220 41,863 CONSOLIDATED STATEMENTS OF CASH FLOWS - USD ($) $ in Millions 12 Months Ended Dec. 31, Dec. 31, Dec. 31, 2019 2018 2017 $7,353 2.432 237 370 (350) 519 (716) 453 (8) (423) (2) $ 12,559 2,399 256 308 (255) 221 (1,708) (531) (28) (115) (4,347) $ 4,908 2,369 292 295 (113) 221 (220) 619 2,451 (650) (190) (87) 735 (287) 263 9,649 (253) (174) 9 882 448 (256) 9,415 (202) (168) 20 201 (338) (305) 10,030 (2,969) 180 OPERATING ACTIVITIES CONSOLIDATED NET INCOME Depreciation and amortization Stock-based compensation expense Restructuring and impairment charges Cash payments for restructing charges Pension and retiree medical plan expense Pension and retiree medical plan contributions Deferred income taxes and other tax charges and credits Net tax related to TCJ Act Tax payments related to TCJ Act Other net tax benefits related to international reorganizations Changes in operating assets and liabilities Accounts and notes receivable Inventories Prepaid expenses and other current assets Accounts payable and other current liabilities Income taxes payable Other, net Net cash provided by operating activities INVESTING ACTIVITIES Capital spending Sales of property, plant and equipment Acquisition of Mayer net of cash and cash equivalents acquired Other acquisitions and investments in noncontrolled affiliates Divestitures Short-term investments Other investing, net Net cash provided by (used in) investing activities FINANCING ACTIVITIES Issuances of long-term debt Payments of long-term debt Debt redemption/cash tender and exchange offers Short-term borrowings, net Cash dividends paid Purchases of stock for treasury Prodeeds from exercise of stock options Other financing activities Net cash provided by (used in) financing activities EFFECT OF EXCHANGE RATE CHANGES ON CASH AND CASH EQUIVALENTS CASH AND CASH EQUIVALENTS Net increase (decrease) in cash, cash equivalents, restricted cash and restricted cash equivalents during the Cash, Cash Equivalents, Restricted Cash and Restricted Cash Equivalents at the Beginning of the Year Cash, Cash Equivalents, Restricted Cash and Restricted Cash Equivalents at the End of the Year Restricted Cash and Restricted Cash Equivalents not included in Cash and Cash Equivalents on Balance Cash and cash equivalents (4,232) 170 (1,939) (778) 253 97 (3,282) 134 (1,197) (299) 505 8,701 2 4,564 (61) 267 (1,849) 29 (4,403) (6,437) 7,509 (4,406) 4,621 (3,970) (1,007) 1 (5,304) (3,000) 215 (45) (8,489) 78 (4,007) (1,589 (1,366) (4,930) (2,002) 178 (53) (13,769) (98) (1,053) (4,472) (2,005) 317 (76) (4,186) 47 112 10,657 (5,199) 10,769 5.570 $ 257 $ 6,480 10.769 241 $ 9,077 1,488 9,169 10.657 271 $ 6,102 Additional Information (in millions) Current Liabilities Total Liabilities Total Stockholders' Equity Net Sales 2019 17,541 63,679 14,868 67,161 2018 18,112 63,046 14,602 64,661 2017 20,502 68,823 10,981 63,525 2016 21,135 62.291 11,199 62,799 AC 313 Intermediate Accounting III, Spring 2021 Excel Project III Statement of Cash Flow Learning Objectives 1. Analyze statement of cash flows 2. Calculate key financial ratios 3. Interpret key financial ratios 4. Produce professional Excel worksheet 5. Hone professional writing The purpose of a statement of cash flows is to provide relevant information about a company's cash inflows and outflows for a period that assists investors and creditors in projecting the company's future cash flows. Also, users of the financial statements compute key financial ratios to evaluate and compare companies. The following are key financial ratios computed with information presented on the statement of cash flows: Current cash debt coverage measures whether a company can pay its current debts with cash provided from operating activities (Liquidity). A company's liquidity is dependent its ability to general additional cash to cover debt payments. Net cash provided by operating activities Average current liabilities Cash debt coverage measures a company's ability to pay debts with cash provided from operating activities (Solvency). Net cash provided by operating activities Average total liabilities Cash return on sales (Profitability) Net cash provided by operating activities Net sales Free cash flow measures the discretionary cash that a company has to invest in long-term assets, to retire debt, or to make distributions to shareholders. The amount of free cash is considered available for discretionary purposes such as debt reduction or new investment purchases (Flexibility). Net cash provided by operating activities-Capital expenditures-Cash dividends=Free Cash Flow AC 313 Intermediate Accounting III, Spring 2021 The statement of cash flows for Company A and Company B are presented in the data set file. Also, additional information for each company is provided to use to complete the following requirements. Requirements: 1. On a separate worksheet create a schedule for each company summarizing the net cash provided by activities over the three-year period. Label the worksheet ActivitiesSum. On the worksheet display the summary in a clustered column chart for each company. Place the cluster column chart next the schedule of each company. 2. Based on the statement of cash flow and the outcome of the summary, answer the following questions for each company. Provide evidence for your conclusions. Place your conclusion below the summary schedules and clustered column charts. a. Is the cash provided by operating activities increasing or decreasing over the three-year period? b. Are either or both Company A and Company B expanding its business or contracting its business as evidenced by the investing activities? c. Have Company A and Company B increasing or decreasing its long-term debt over the three-year period? d. What is the most notable financing activity reported for Company A and Company B over the three-year period? What was the amount of cash received or paid for that activity each year? 3. On a separate worksheet create a schedule for each company to present the key financial ratios for the three-year period. Label the worksheet SCFRatios. (Use formulas above to calculate ratios). What pattern do you detect for each company over the three-year period? What conclusions concerning the management of cash of each company can be drawn from the ratios computed? Include in your description the liquidity, solvency, and profitability aspect. In your view which company has a strong cash position? Support your view with reference to evidence. Place answers in cell below ratio calculations. 4. The worksheets should be formatted with appropriate numeric values using accounting format with zero decimals. Financial ratios should be carried out two decimal places. Also, you should include proper titles on worksheets and charts, and display in a professional style. 5. Use cell referencing and appropriate formulas in creating worksheets. Excel Project III Due: 5/9/2021 via Blackboard CONSOLIDATED STATEMENTS OF CASH FLOWS - USD ($) $ in Millions 12 Months Ended Dec. 31, Dec. 31, Dec. 31, 2019 2018 2017 $ 8,985 1,365 201 (280) (421) 91 (467) 127 504 366 10,471 $ 6,476 1,086 225 (413) (457) (50) 743 558 699 (1,240) 7,627 $ 1,283 1,260 219 (1,252) (628) 292 1,459 1,218 (252) 3,442 7,041 OPERATING ACTIVITIES CONSOLIDATED NET INCOME Depreciation and amortization Stock-based compensation expense Deferred income taxes Equity (income) loss - net of dividends Foreign currency adjustments Significant (gains) losses on sales of assets - net Other operating charges Other items Net change in operating assets and liabilities Net cash provided by operating activities INVESTING ACTIVITIES Purchases of investments Proceeds from disposals of investments Acquisitions of businesses, equity method investments and Proceeds from disposals of businesses, equity method investments and Purchases of property, plant and equipment Proceeds from disposals of property, plant and equipment Other investing activities Net cash provided by (used in) investing activities FINANCING ACTIVITIES Issuances of debt Payments of debt Issuances of stock Purchases of stock for treasury Dividends Other financing activities Net cash provided by (used in) financing activities EFFECT OF EXCHANGE RATE CHANGES ON CASH AND CASH CASH AND CASH EQUIVALENTS Net increase (decrease) in cash, cash equivalents, restricted cash and Cash, Cash Equivalents, Restricted Cash and Restricted Cash Cash, Cash Equivalents, Restricted Cash and Restricted Cash Restricted Cash and Restricted Cash Equivalents not included in Cash Cash and cash equivalents (4,704) 6,973 (5,542) 429 (2,054) 978 (56) (3,976) (7,789) 14,977 (1,263) 1,362 (1,548) 248 (60) 5,927 (17,296) 16,694 (3,809) 3,821 (1,750) 108 (80) (2,312) 23,009 (24,850) 1,012 (1,103) (6,845) (227) (9,004) (72) 27,605 (30,600) 1,476 (1,912) (6,644) (272) (10,347) (262) 29,926 (28,871) 1,595 (3,682) (6,320) (95) (7,447) 241 (2,581) 9,318 6,737 257 $ 6,480 2,945 6,373 9,318 241 $ 9,077 (2,477) 8,850 6,373 271 $ 6,102 Additional Information (in millions) Current Liabilities Total Liabilities Total Stockholders' Equity Net Sales 2019 26,973 38310 21,098 37,266 2018 29,223 64,160 19,056 34,300 2017 27,194 68,919 18,977 36,212 2016 26,532 64,050 23,220 41,863 CONSOLIDATED STATEMENTS OF CASH FLOWS - USD ($) $ in Millions 12 Months Ended Dec. 31, Dec. 31, Dec. 31, 2019 2018 2017 $7,353 2.432 237 370 (350) 519 (716) 453 (8) (423) (2) $ 12,559 2,399 256 308 (255) 221 (1,708) (531) (28) (115) (4,347) $ 4,908 2,369 292 295 (113) 221 (220) 619 2,451 (650) (190) (87) 735 (287) 263 9,649 (253) (174) 9 882 448 (256) 9,415 (202) (168) 20 201 (338) (305) 10,030 (2,969) 180 OPERATING ACTIVITIES CONSOLIDATED NET INCOME Depreciation and amortization Stock-based compensation expense Restructuring and impairment charges Cash payments for restructing charges Pension and retiree medical plan expense Pension and retiree medical plan contributions Deferred income taxes and other tax charges and credits Net tax related to TCJ Act Tax payments related to TCJ Act Other net tax benefits related to international reorganizations Changes in operating assets and liabilities Accounts and notes receivable Inventories Prepaid expenses and other current assets Accounts payable and other current liabilities Income taxes payable Other, net Net cash provided by operating activities INVESTING ACTIVITIES Capital spending Sales of property, plant and equipment Acquisition of Mayer net of cash and cash equivalents acquired Other acquisitions and investments in noncontrolled affiliates Divestitures Short-term investments Other investing, net Net cash provided by (used in) investing activities FINANCING ACTIVITIES Issuances of long-term debt Payments of long-term debt Debt redemption/cash tender and exchange offers Short-term borrowings, net Cash dividends paid Purchases of stock for treasury Prodeeds from exercise of stock options Other financing activities Net cash provided by (used in) financing activities EFFECT OF EXCHANGE RATE CHANGES ON CASH AND CASH EQUIVALENTS CASH AND CASH EQUIVALENTS Net increase (decrease) in cash, cash equivalents, restricted cash and restricted cash equivalents during the Cash, Cash Equivalents, Restricted Cash and Restricted Cash Equivalents at the Beginning of the Year Cash, Cash Equivalents, Restricted Cash and Restricted Cash Equivalents at the End of the Year Restricted Cash and Restricted Cash Equivalents not included in Cash and Cash Equivalents on Balance Cash and cash equivalents (4,232) 170 (1,939) (778) 253 97 (3,282) 134 (1,197) (299) 505 8,701 2 4,564 (61) 267 (1,849) 29 (4,403) (6,437) 7,509 (4,406) 4,621 (3,970) (1,007) 1 (5,304) (3,000) 215 (45) (8,489) 78 (4,007) (1,589 (1,366) (4,930) (2,002) 178 (53) (13,769) (98) (1,053) (4,472) (2,005) 317 (76) (4,186) 47 112 10,657 (5,199) 10,769 5.570 $ 257 $ 6,480 10.769 241 $ 9,077 1,488 9,169 10.657 271 $ 6,102 Additional Information (in millions) Current Liabilities Total Liabilities Total Stockholders' Equity Net Sales 2019 17,541 63,679 14,868 67,161 2018 18,112 63,046 14,602 64,661 2017 20,502 68,823 10,981 63,525 2016 21,135 62.291 11,199 62,799