Answered step by step
Verified Expert Solution
Question
1 Approved Answer
Acceleration T(s) Plot the followings according to the earthquake data given. Notes: Damping is 5%. Make y-axis in g (9.81 m/s2) for acceleration spectra. (8)
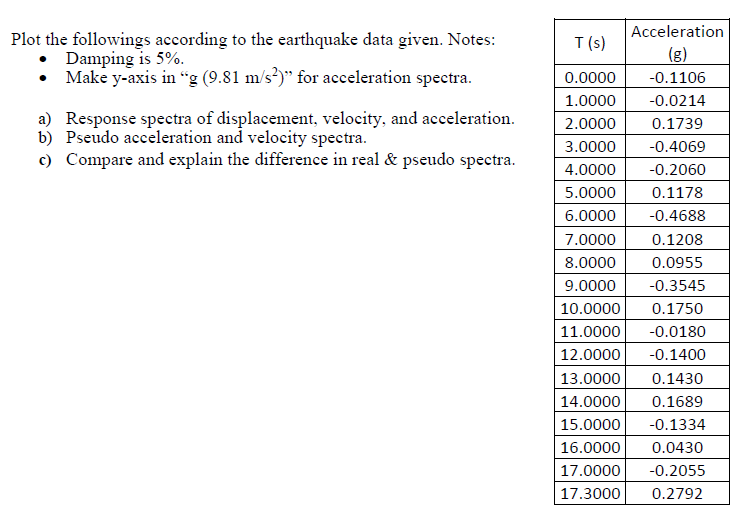
Acceleration T(s) Plot the followings according to the earthquake data given. Notes: Damping is 5%. Make y-axis in g (9.81 m/s2) for acceleration spectra. (8) 0.0000 -0.1106 1.0000 -0.0214 2.0000 0.1739 a) Response spectra of displacement, velocity, and acceleration. b) Pseudo acceleration and velocity spectra. c) Compare and explain the difference in real & pseudo spectra. 3.0000 -0.4069 4.0000 -0.2060 5.0000 0.1178 6.0000 -0.4688 7.0000 0.1208 8.0000 0.0955 9.0000 -0.3545 10.0000 0.1750 11.0000 -0.0180 12.0000 -0.1400 13.0000 0.1430 0.1689 14.0000 15.0000 -0.1334 16.0000 0.0430 17.0000 -0.2055 17.3000 0.2792 Acceleration T(s) Plot the followings according to the earthquake data given. Notes: Damping is 5%. Make y-axis in g (9.81 m/s2) for acceleration spectra. (8) 0.0000 -0.1106 1.0000 -0.0214 2.0000 0.1739 a) Response spectra of displacement, velocity, and acceleration. b) Pseudo acceleration and velocity spectra. c) Compare and explain the difference in real & pseudo spectra. 3.0000 -0.4069 4.0000 -0.2060 5.0000 0.1178 6.0000 -0.4688 7.0000 0.1208 8.0000 0.0955 9.0000 -0.3545 10.0000 0.1750 11.0000 -0.0180 12.0000 -0.1400 13.0000 0.1430 0.1689 14.0000 15.0000 -0.1334 16.0000 0.0430 17.0000 -0.2055 17.3000 0.2792
Step by Step Solution
There are 3 Steps involved in it
Step: 1
Get Instant Access to Expert-Tailored Solutions
See step-by-step solutions with expert insights and AI powered tools for academic success
Step: 2
Step: 3
Ace Your Homework with AI
Get the answers you need in no time with our AI-driven, step-by-step assistance
Get Started