

Answered step by step
Verified Expert Solution
Question
1 Approved Answer
In this exercise we will implement a simplified version of a Moran process. A Moran process is a stochastic process used in biology to
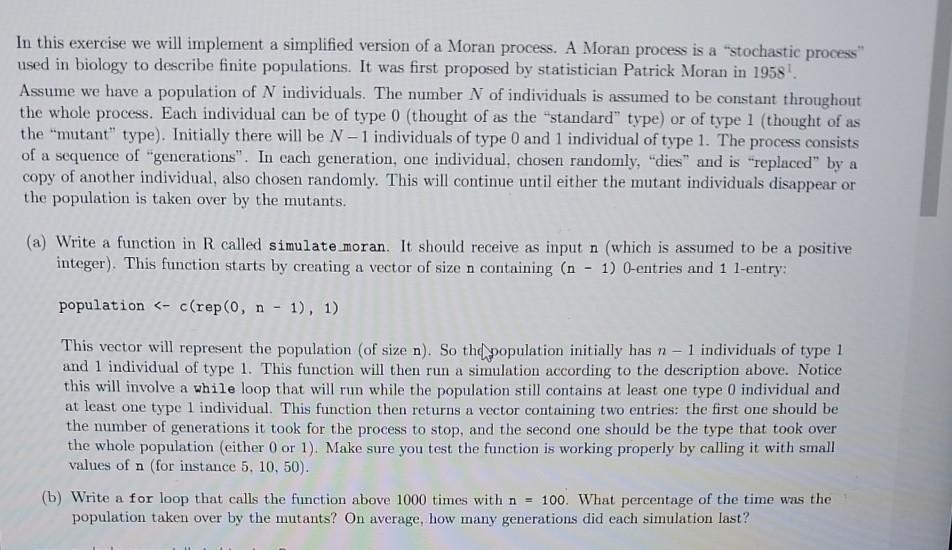
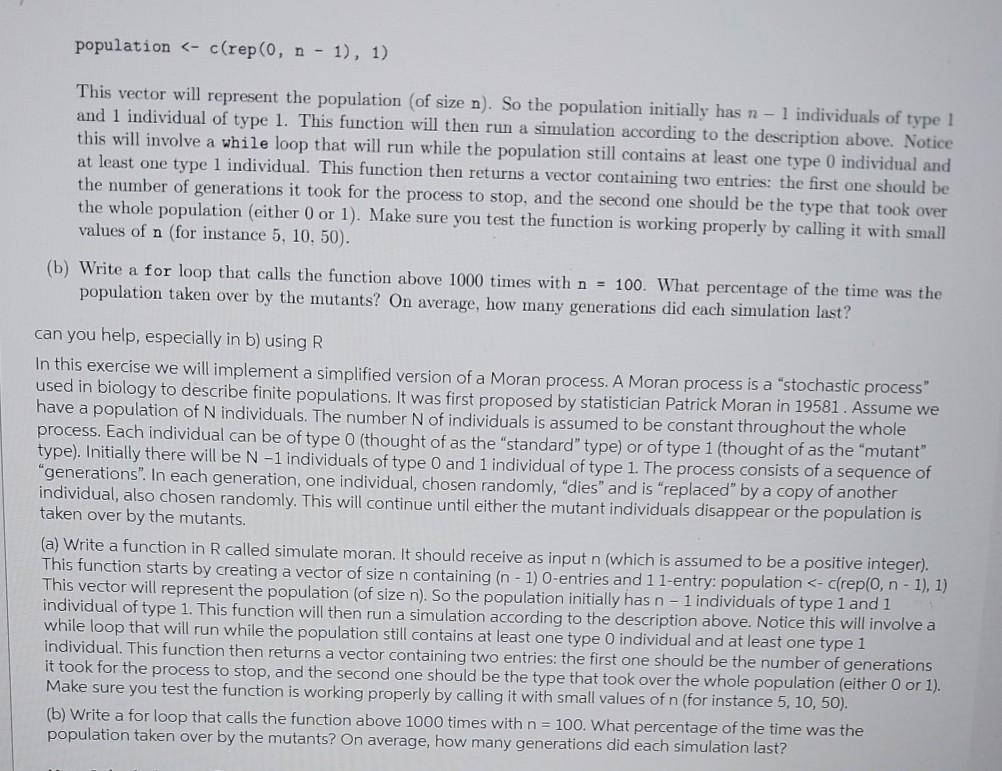
In this exercise we will implement a simplified version of a Moran process. A Moran process is a "stochastic process" used in biology to describe finite populations. It was first proposed by statistician Patrick Moran in 1958. Assume we have a population of N individuals. The number N of individuals is assumed to be constant throughout the whole process. Each individual can be of type 0 (thought of as the "standard" type) or of type 1 (thought of as the "mutant" type). Initially there will be N-1 individuals of type 0 and 1 individual of type 1. The process consists of a sequence of "generations". In each generation, one individual, chosen randomly, "dies" and is "replaced" by a copy of another individual, also chosen randomly. This will continue until either the mutant individuals disappear or the population is taken over by the mutants. (a) Write a function in R called simulate moran. It should receive as input n (which is assumed to be a positive integer). This function starts by creating a vector of size n containing (n - 1) 0-entries and 1 1-entry: population population
Step by Step Solution
There are 3 Steps involved in it
Step: 1

Get Instant Access to Expert-Tailored Solutions
See step-by-step solutions with expert insights and AI powered tools for academic success
Step: 2

Step: 3
Ace Your Homework with AI
Get the answers you need in no time with our AI-driven, step-by-step assistance
Get Started
Elementary Statistics
Authors: Neil A. Weiss
8th Edition
321691237, 978-0321691231