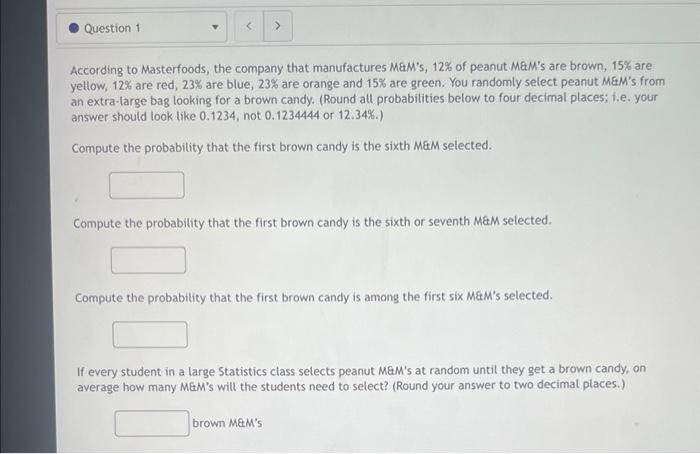
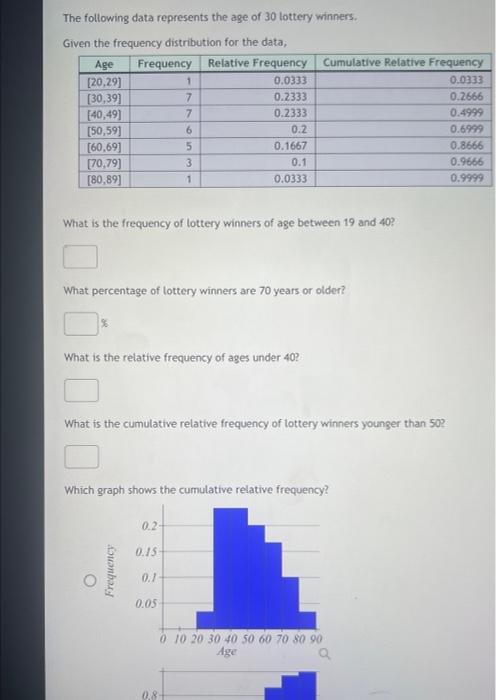
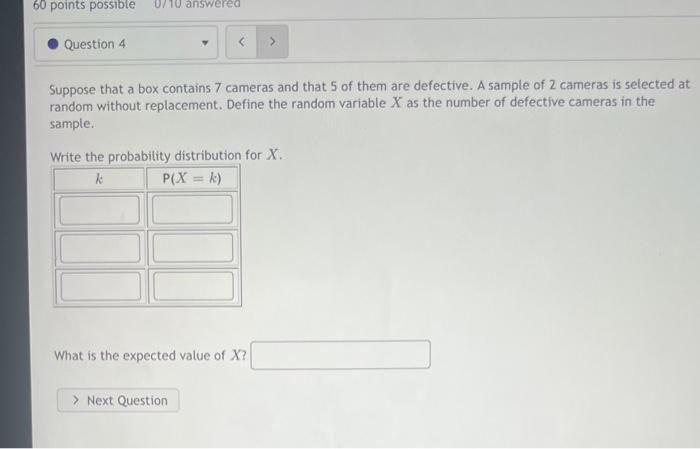
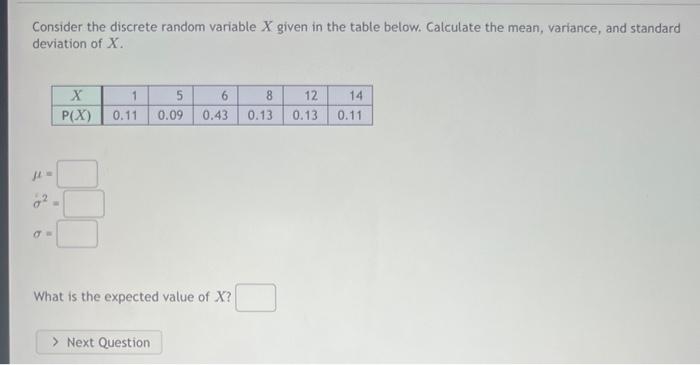
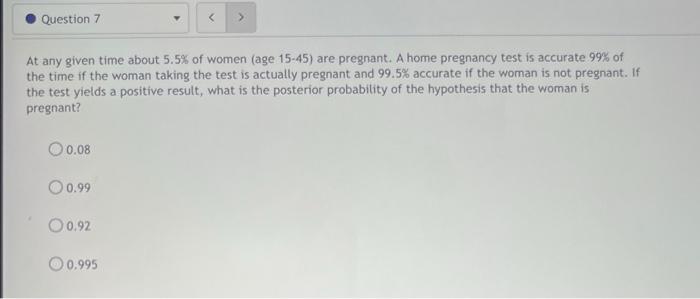
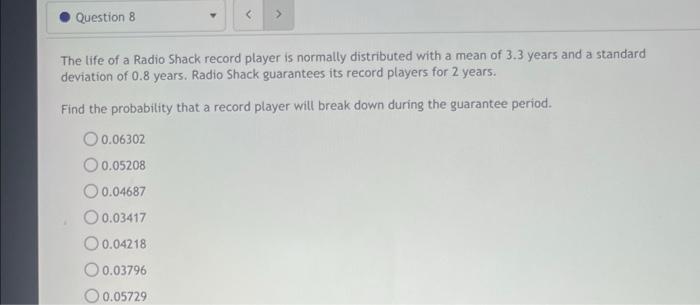
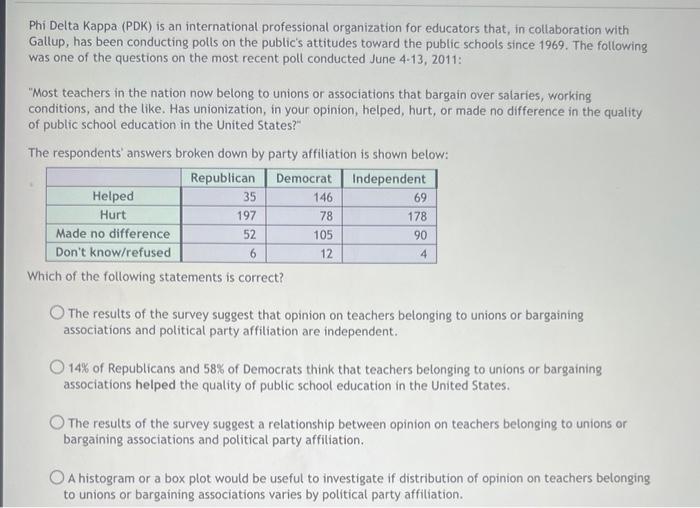
According to Masterfoods, the company that manufactures MEM's, 12\% of peanut MaM's are brown, 15% are yellow, 12% are red, 23\% are blue, 23% are orange and 15% are green. You randomly select peanut MaM's from an extra-large bag looking for a brown candy. (Round all probabilities below to four decimal places; f.e. your answer should look like 0.1234, not 0.1234444 or 12.34%.) Compute the probability that the first brown candy is the sixth MaM selected. Compute the probability that the first brown candy is the sixth or seventh MaM selected. Compute the probability that the first brown candy is among the first six MaM's selected. If every student in a large Statistics class selects peanut MaM's at random until they get a brown candy, on average how many MEM's will the students need to select? (Round your answer to two decimal places.) brown MEM's The following data represents the age of 30 lottery winners. Comolete the freauency distribution for the data. The following data represents the age of 30 lottery winners. Given the frequency distribution for the data; What is the frequency of tottery winners of age between 19 and 40 ? What percentage of lottery winners are 70 years or older? What is the relative frequency of ages under 40 ? What is the cumulative relative frequency of lottery winners younger than 50 ? Which graph shows the cumulative relative frequency? Suppose that a box contains 7 cameras and that 5 of them are defective. A sample of 2 cameras is selected at random without replacement. Define the random variable X as the number of defective cameras in the sample. Write the probability distribution for X. What is the expected value of X ? For the data shown, answer the questions. Round to 2 decimal places. Consider the discrete random variable X given in the table below. Calculate the mean, variance, and standard deviation of X. =2= = What is the expected value of X ? At any given time about 5.5% of women (age 15-45) are pregnant. A home pregnancy test is accurate 99% of the time if the woman taking the test is actually pregnant and 99.5% accurate if the woman is not pregnant. If the test yields a positive result, what is the posterior probability of the hypothesis that the woman is pregnant? 0.08 0.99 0.92 0.995 The life of a Radio Shack record player is normally distributed with a mean of 3.3 years and a standard deviation of 0.8 years. Radio Shack guarantees its record players for 2 years. Find the probability that a record player will break down during the guarantee period. 0.06302 0.05208 0.04687 0.03417 0.04218 0.03796 0.05729 Phi Delta Kappa (PDK) is an international professional organization for educators that, in collaboration with Gallup, has been conducting polls on the public's attitudes toward the public schools since 1969 . The following was one of the questions on the most recent poll conducted June 413,2011 : "Most teachers in the nation now belong to unions or associations that bargain over salaries, working conditions, and the like. Has unionization, in your opinion, helped, hurt, or made no difference in the quality of public school education in the United States? The respondents' answers broken down by party affiliation is shown below: Which of the following statements is correct? The results of the survey suggest that opinion on teachers belonging to unions or bargaining associations and political party affiliation are independent. 14\% of Republicans and 58% of Democrats think that teachers belonging to unions or bargaining associations helped the quality of public school education in the United States. The results of the survey suggest a relationship between opinion on teachers belonging to unions or bargaining associations and political party affiliation. A histogram or a box plot would be useful to investigate if distribution of opinion on teachers belonging to unions or bargaining associations varies by political party affiliation. This week, a very large running race (5K) occured in Denver. The times were normally distributed, with a mean of 24.1 minutes and a standard deviation of 4.45 minutes. a. What percent of runners took 19.65 minutes or less to complete the race? b. What time in minutes is the cutoff for the fastest 1.39% ? c. What percent of runners took more than 30.775 minutes to complete the race
