According to the 2019 U.S. Census Bureau estimates, 63.4% of the U.S. self-identifies as Non-Hispanic white, 15.3% as Hispanic and Latino, 13.4% as Black or
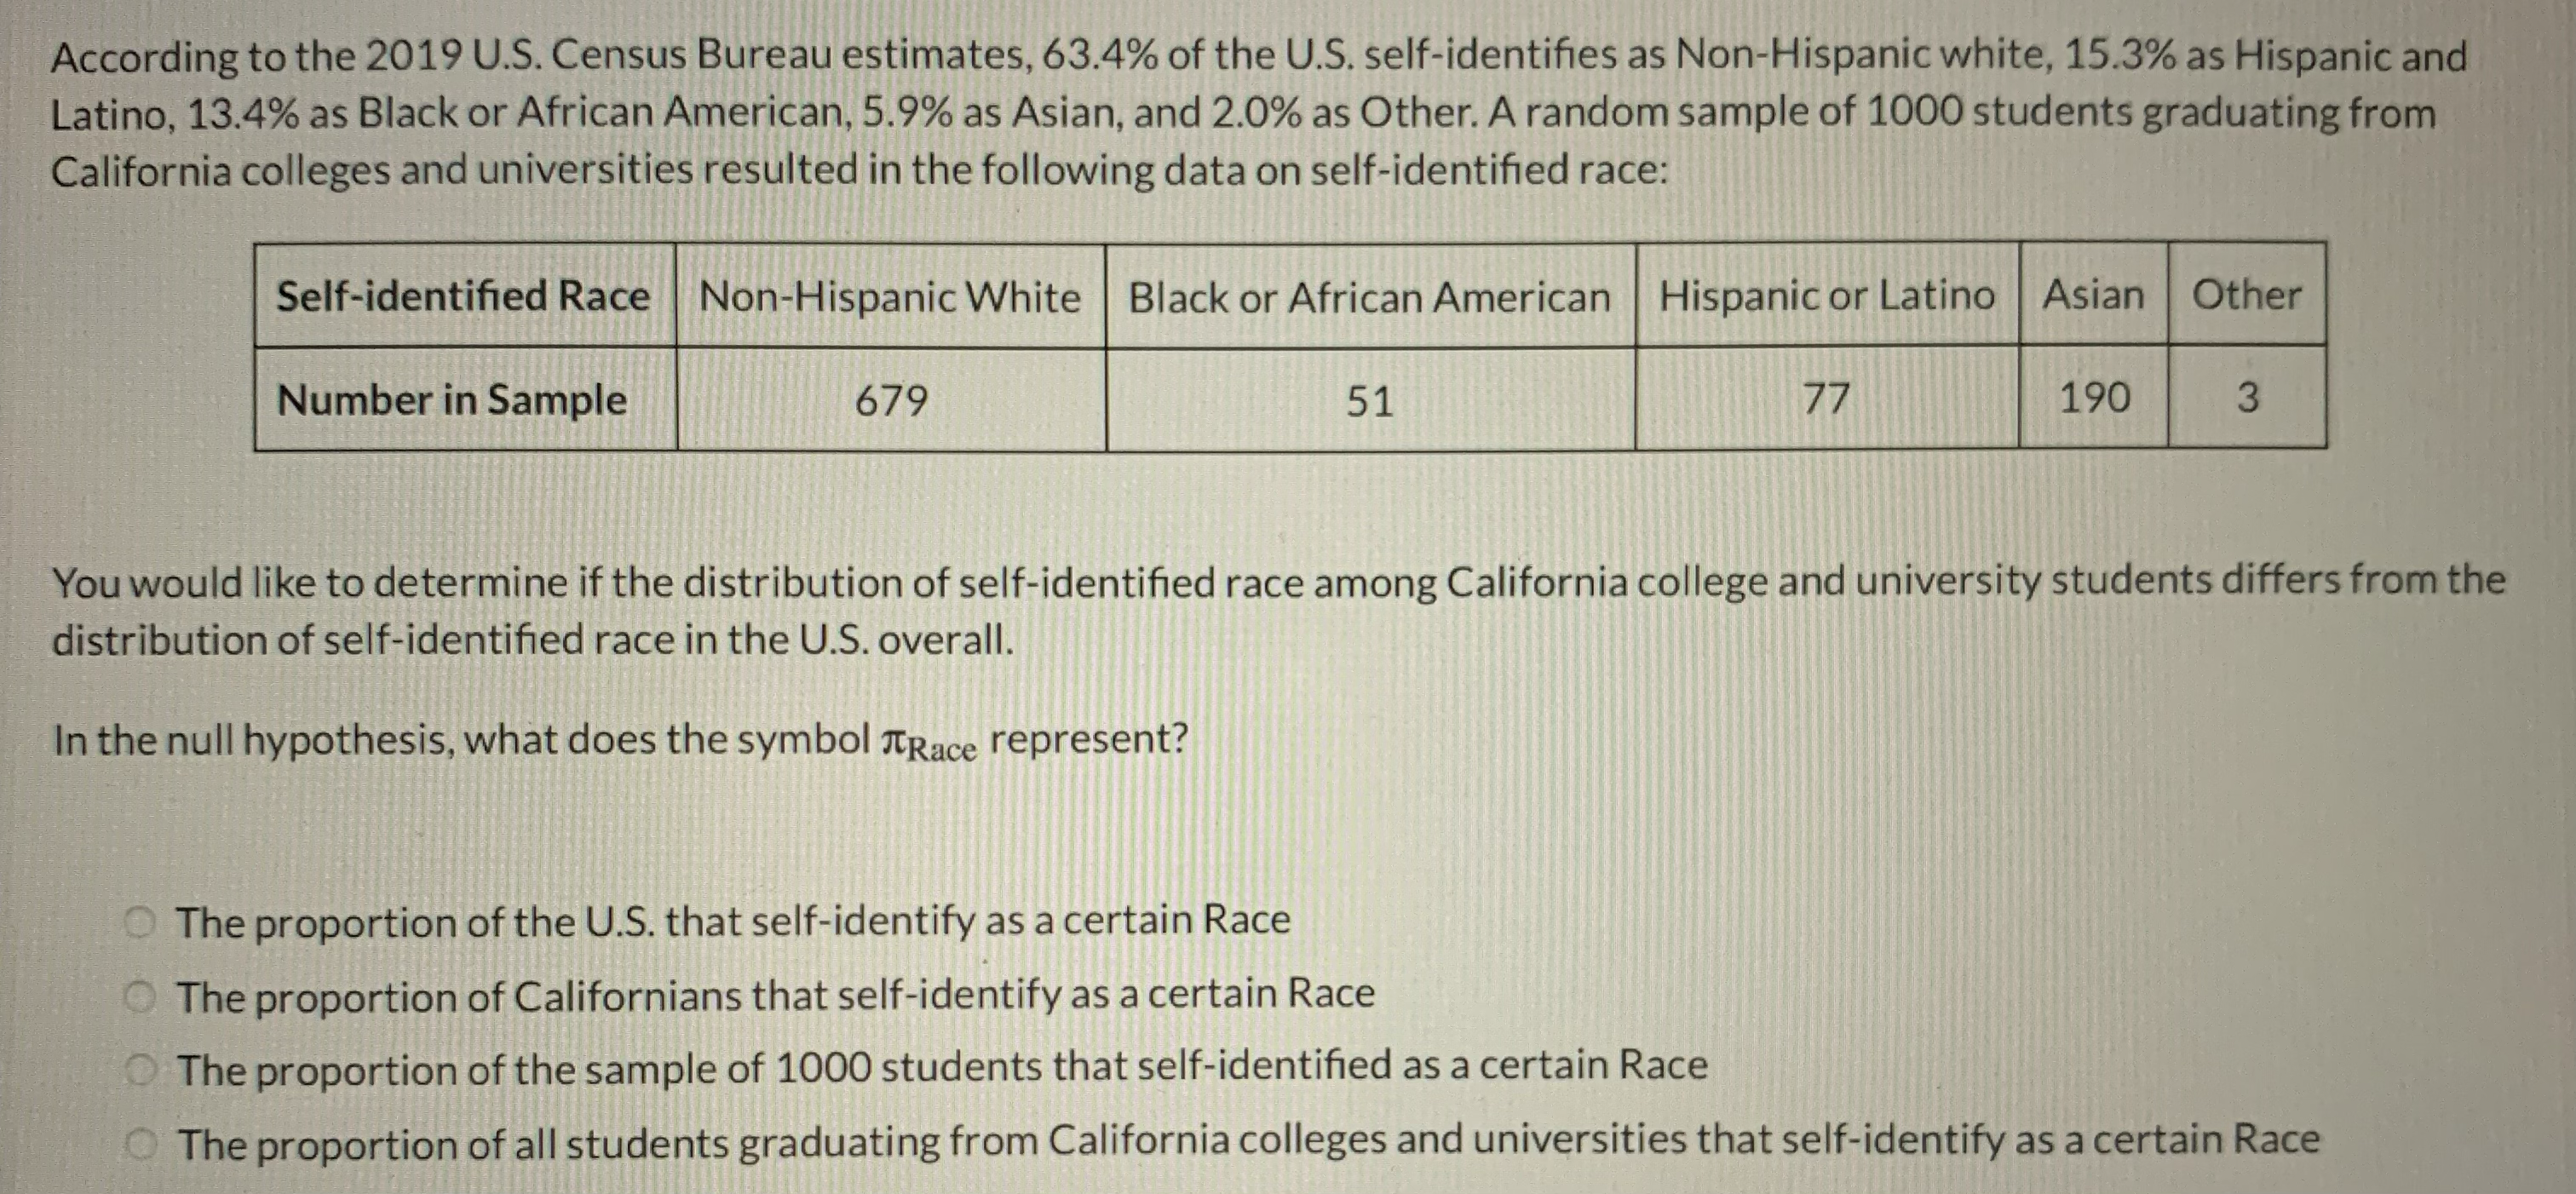
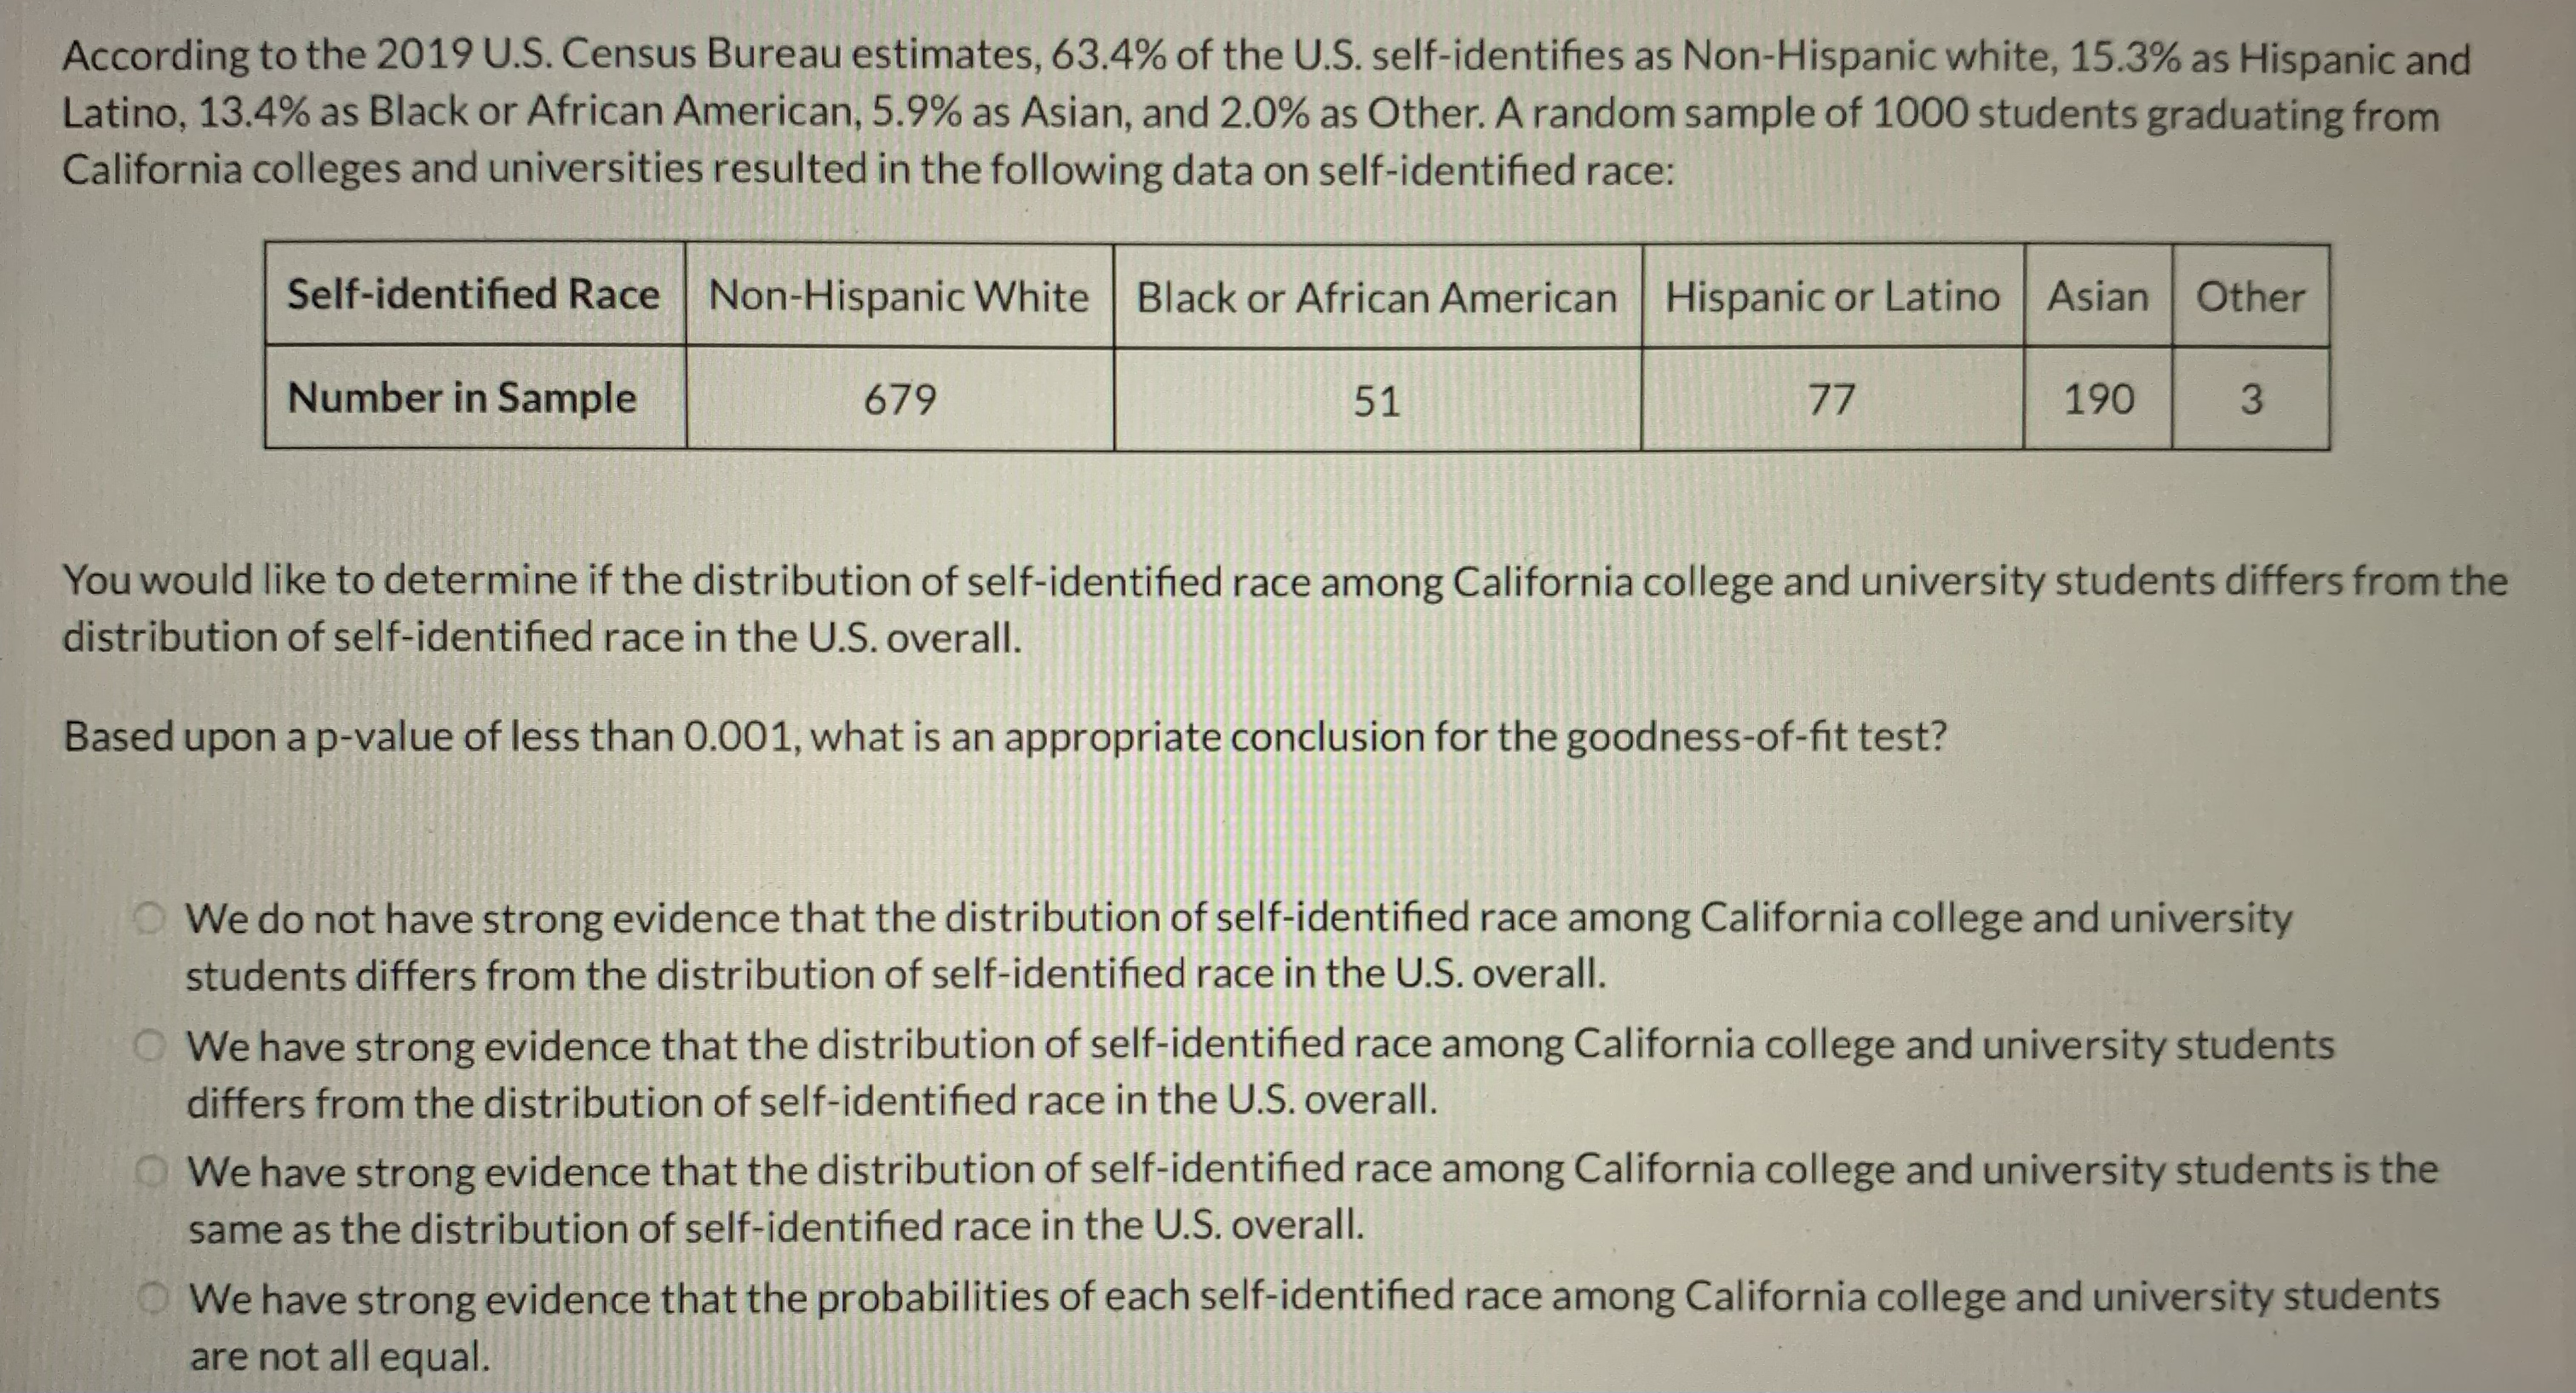
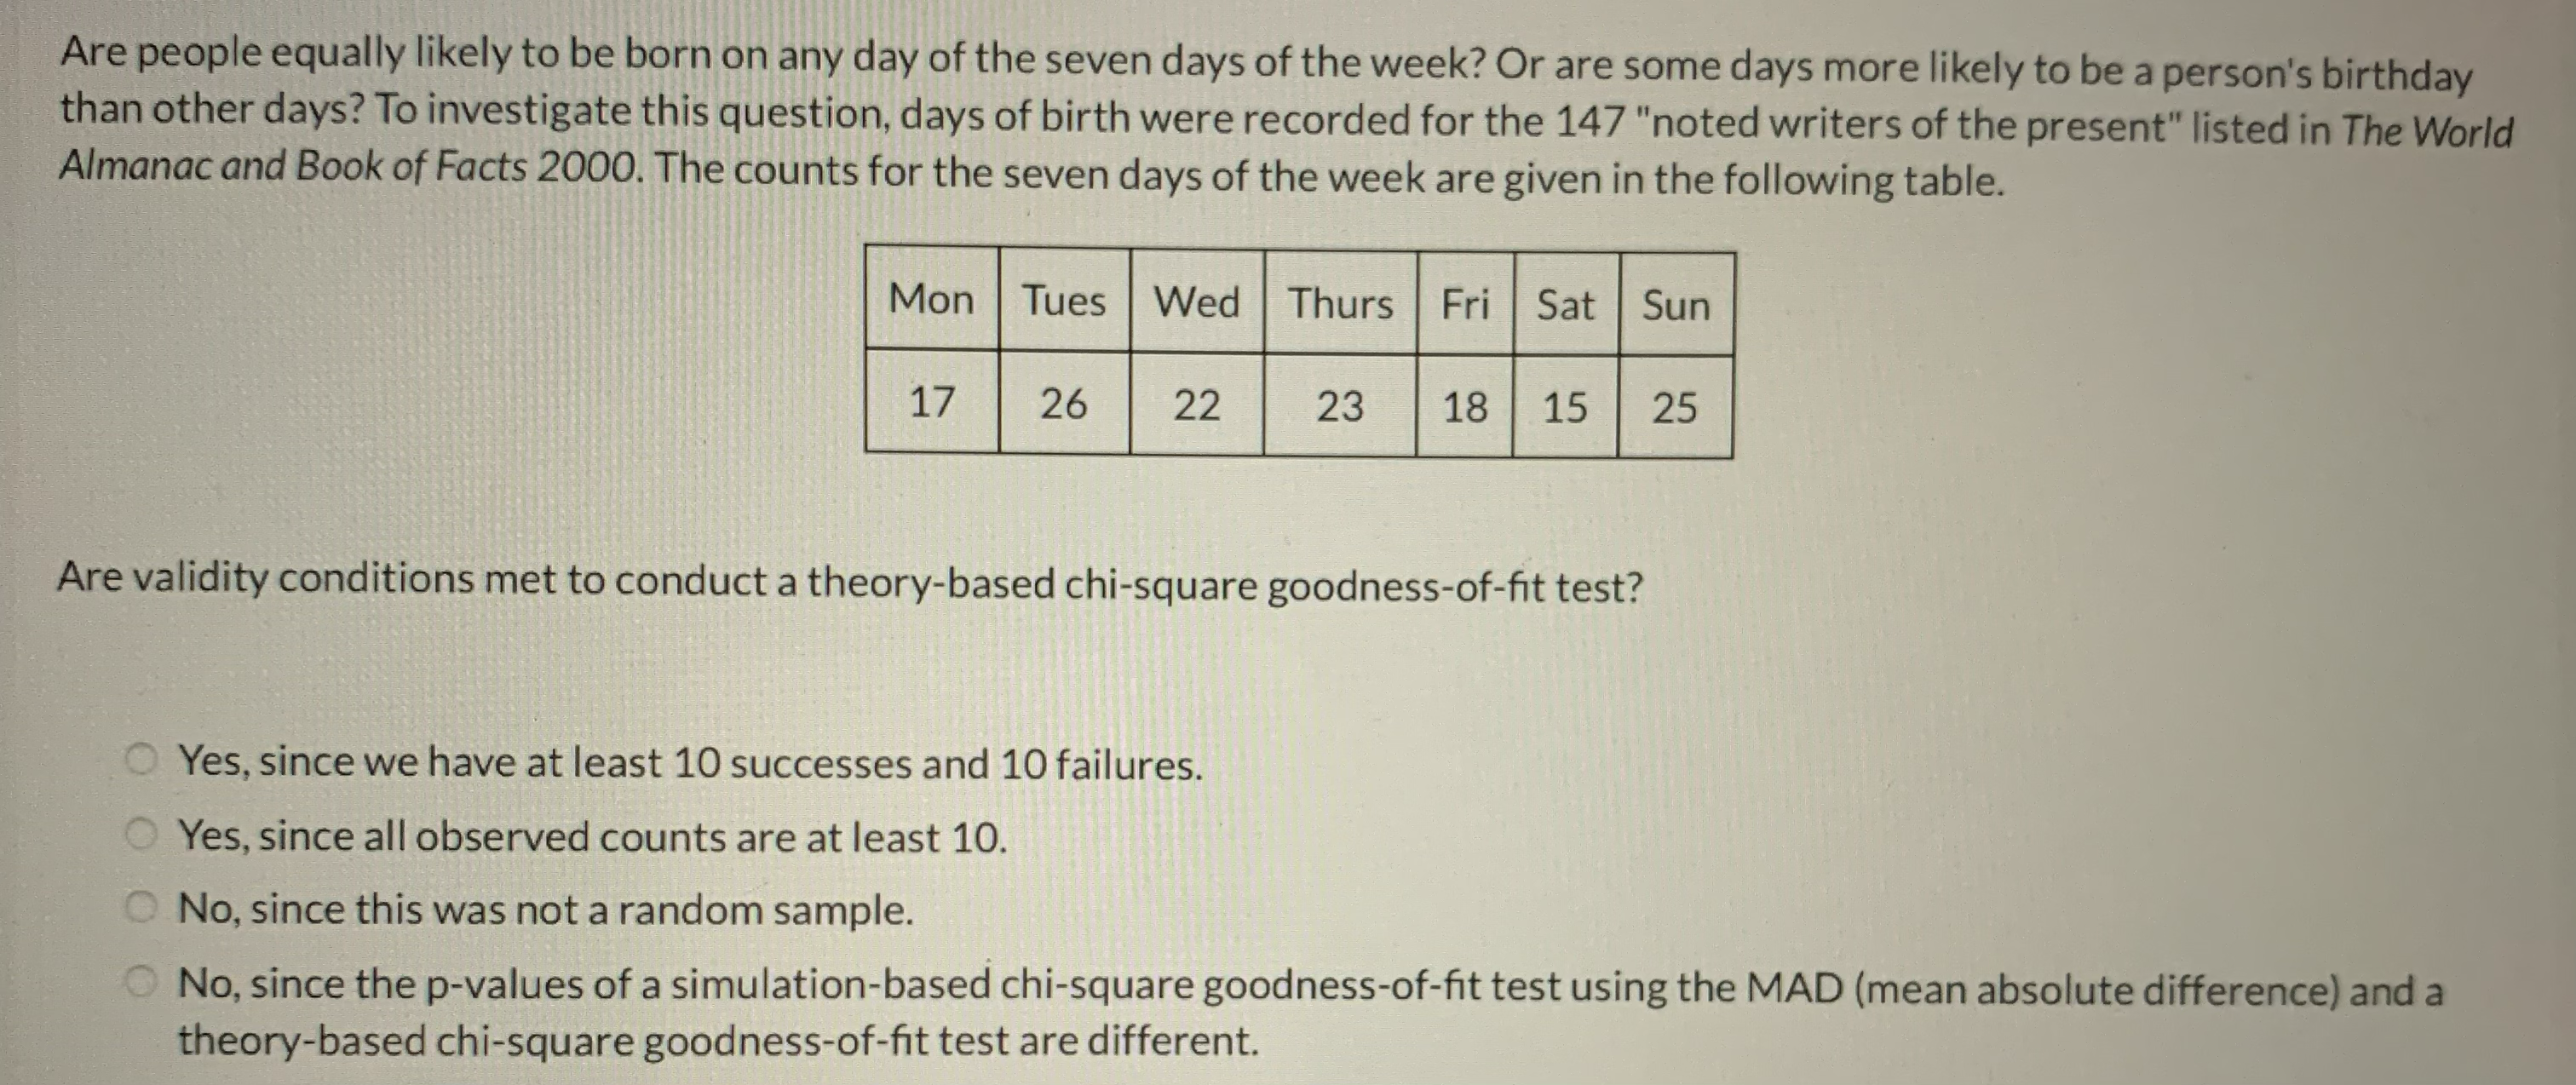
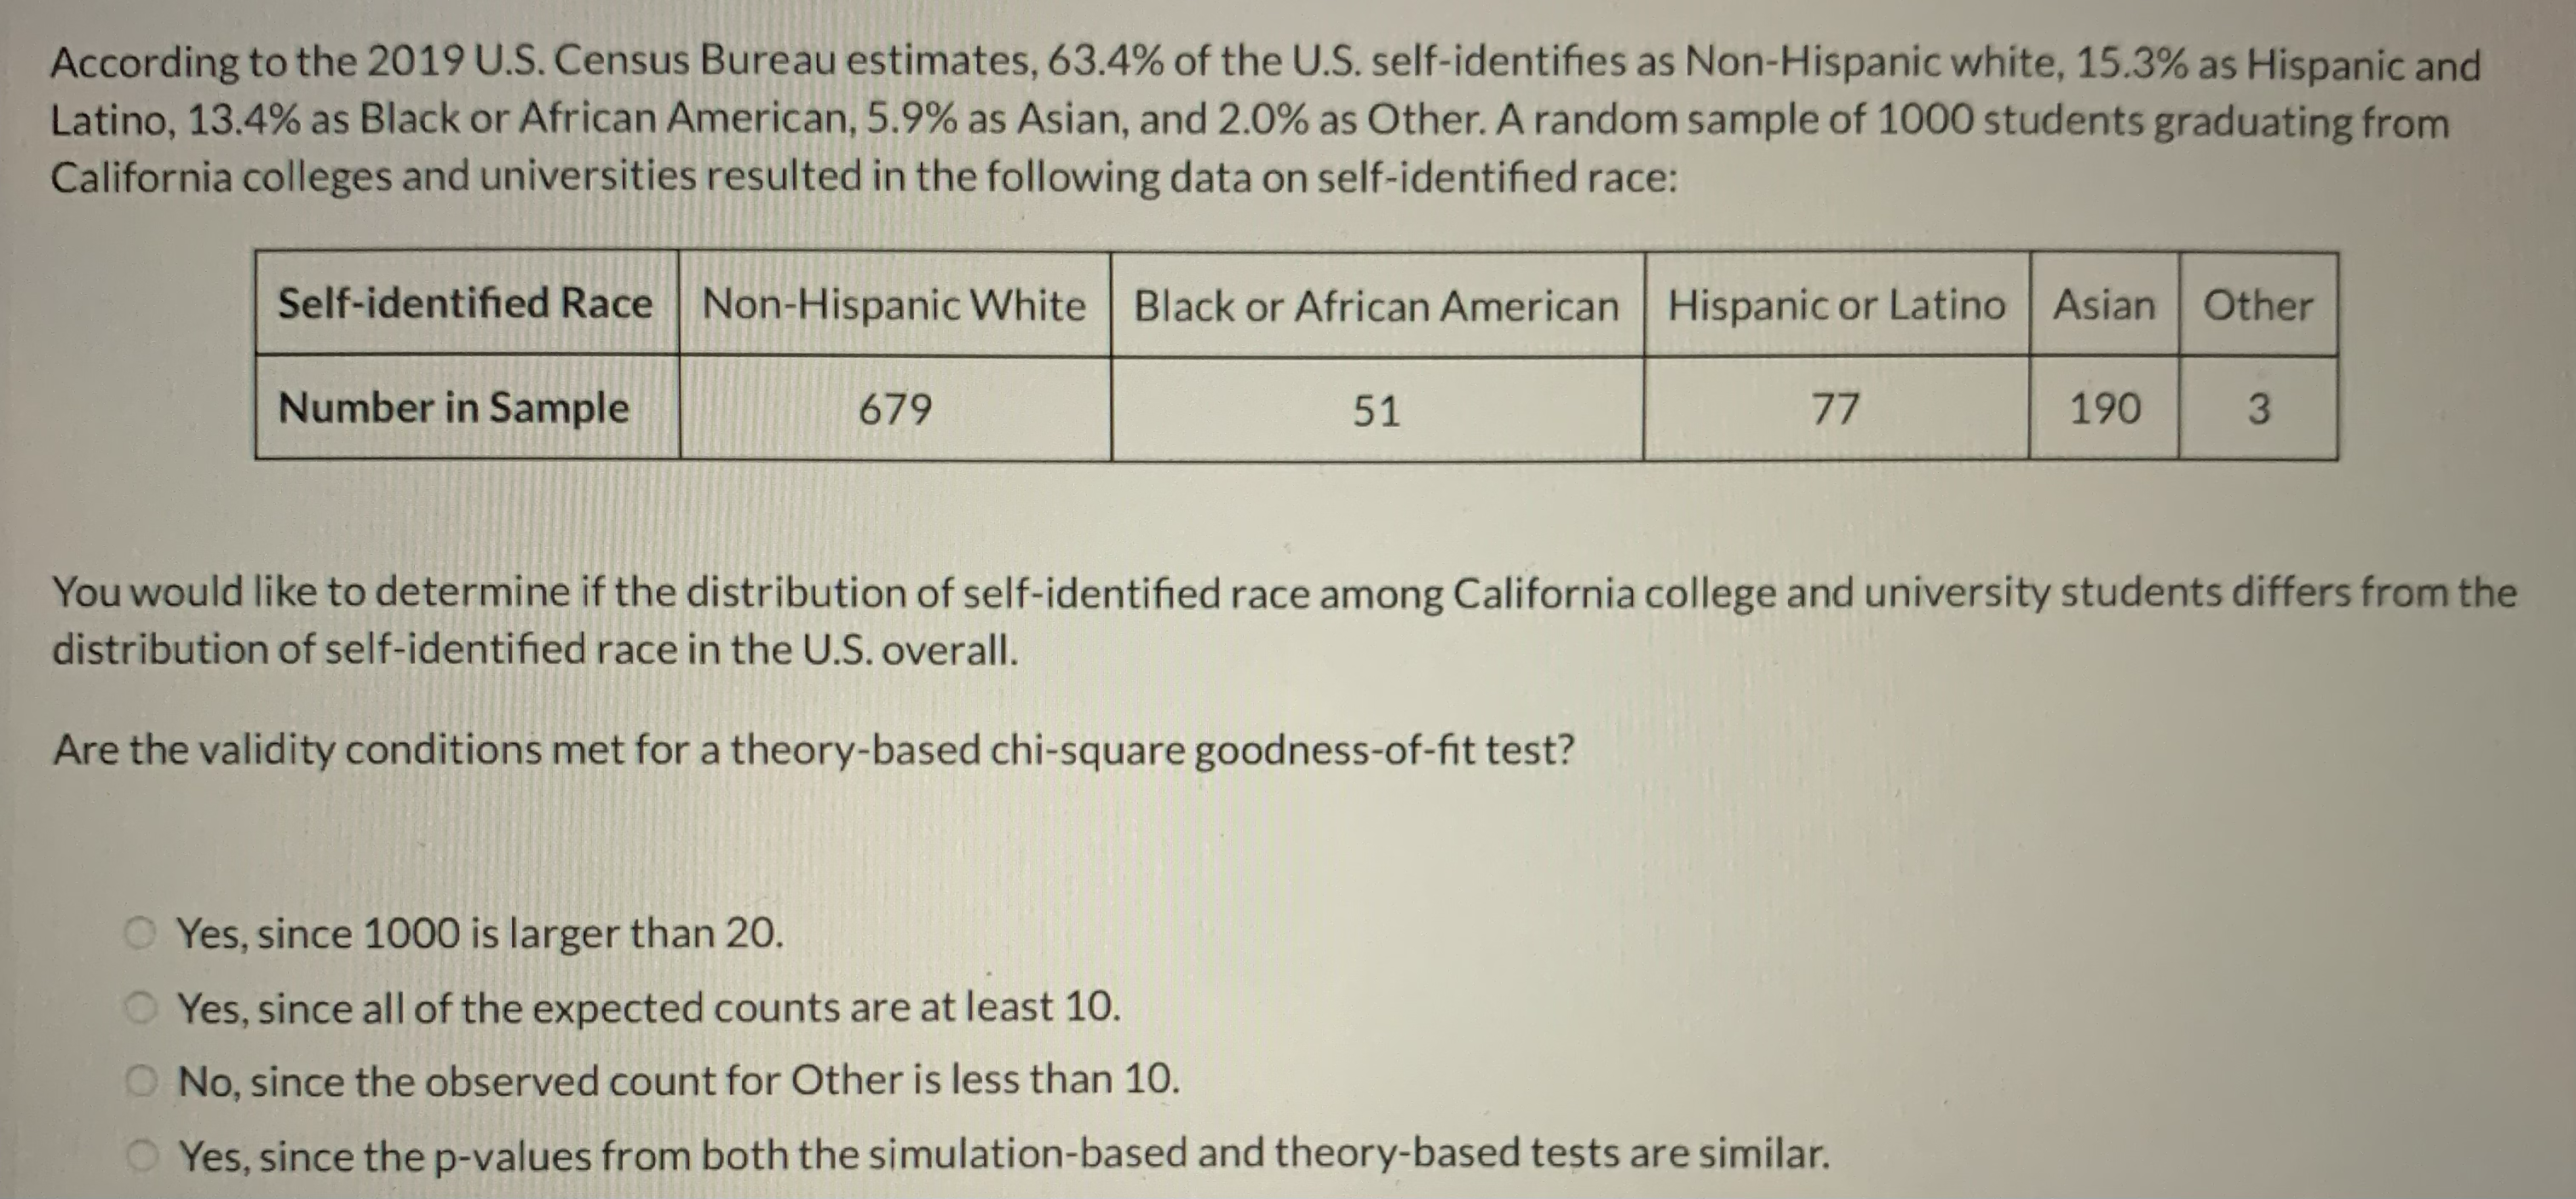
According to the 2019 U.S. Census Bureau estimates, 63.4% of the U.S. self-identifies as Non-Hispanic white, 15.3% as Hispanic and Latino, 13.4% as Black or African American, 5.9% as Asian, and 2.0% as Other. A random sample of 1000 students graduating from California colleges and universities resulted in the following data on self-identified race: Self-identified Race Non-Hispanic White Black or African American Hispanic or Latino Asian Other Number in Sample 679 51 77 190 3 You would like to determine if the distribution of self-identified race among California college and university students differs from the distribution of self-identified race in the U.S. overall. In the null hypothesis, what does the symbol Race represent? O The proportion of the U.S. that self-identify as a certain Race The proportion of Californians that self-identify as a certain Race The proportion of the sample of 1000 students that self-identified as a certain Race The proportion of all students graduating from California colleges and universities that self-identify as a certain RaceAccording to the 2019 U.S. Census Bureau estimates, 63.4% of the U.S. self-identifies as Non-Hispanic white, 15.3% as Hispanic and Latino, 13.4% as Black or African American, 5.9% as Asian, and 2.0% as Other. A random sample of 1000 students graduating from California colleges and universities resulted in the following data on self-identified race: Self-identified Race Non-Hispanic White | Black or African American Hispanic or Latino Asian Other Number in Sample 679 51 77 190 3 You would like to determine if the distribution of self-identified race among California college and university students differs from the distribution of self-identified race in the U.S. overall. Based upon a p-value of less than 0.001, what is an appropriate conclusion for the goodness-of-fit test? We do not have strong evidence that the distribution of self-identified race among California college and university students differs from the distribution of self-identified race in the U.S. overall. We have strong evidence that the distribution of self-identified race among California college and university students differs from the distribution of self-identified race in the U.S. overall. We have strong evidence that the distribution of self-identified race among California college and university students is the same as the distribution of self-identified race in the U.S. overall. We have strong evidence that the probabilities of each self-identified race among California college and university students are not all equal.Are people equally likely to be born on any day of the seven days of the week? Or are some days more likely to be a person's birthday than other days? To investigate this question, days of birth were recorded for the 147 "noted writers of the present" listed in The World Almanac and Book of Facts 2000. The counts for the seven days of the week are given in the following table. Mon Tues Wed Thurs Fri Sat Sun 17 26 22 23 18 15 25 Are validity conditions met to conduct a theory-based chi-square goodness-of-fit test? Yes, since we have at least 10 successes and 10 failures. Yes, since all observed counts are at least 10. O No, since this was not a random sample. No, since the p-values of a simulation-based chi-square goodness-of-fit test using the MAD (mean absolute difference) and a theory-based chi-square goodness-of-fit test are different.According to the 2019 U.S. Census Bureau estimates, 63.4% of the U.S. self-identifies as Non-Hispanic white, 15.3% as Hispanic and Latino, 13.4% as Black or African American, 5.9% as Asian, and 2.0% as Other. A random sample of 1000 students graduating from California colleges and universities resulted in the following data on self-identified race: Self-identified Race Non-Hispanic White Black or African American Hispanic or Latino Asian Other Number in Sample 679 51 77 190 3 You would like to determine if the distribution of self-identified race among California college and university students differs from the distribution of self-identified race in the U.S. overall. Are the validity conditions met for a theory-based chi-square goodness-of-fit test? Yes, since 1000 is larger than 20. Yes, since all of the expected counts are at least 10. No, since the observed count for Other is less than 10. Yes, since the p-values from both the simulation-based and theory-based tests are similar
Step by Step Solution
There are 3 Steps involved in it
Step: 1
Get Instant Access to Expert-Tailored Solutions
See step-by-step solutions with expert insights and AI powered tools for academic success
Step: 2
Step: 3
Ace Your Homework with AI
Get the answers you need in no time with our AI-driven, step-by-step assistance