Answered step by step
Verified Expert Solution
Question
1 Approved Answer
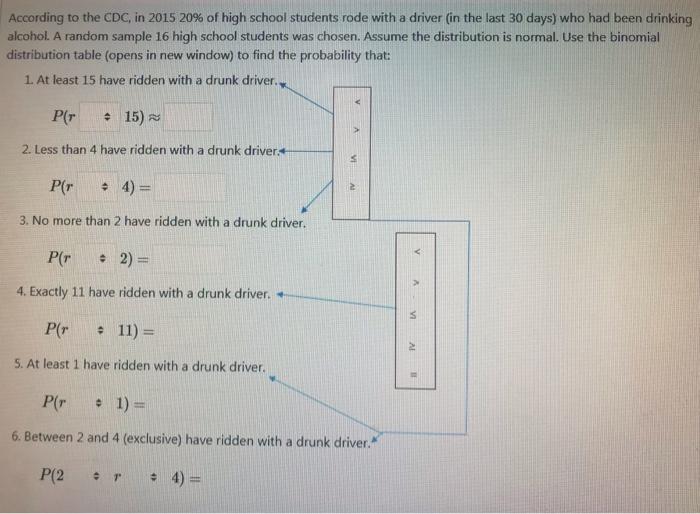
According to the CDC, in 2015 20% of high school students rode with a driver (in the last 30 days) who had been drinking

According to the CDC, in 2015 20% of high school students rode with a driver (in the last 30 days) who had been drinking alcohol. A random sample 16 high school students was chosen. Assume the distribution is normal. Use the binomial distribution table (opens in new window) to find the probability that: 1. At least 15 have ridden with a drunk driver. P(r : 15) 2. Less than 4 have ridden with a drunk driver P(r 4) %3D 3. No more than 2 have ridden with a drunk driver, P(r 2) = 4. Exactly 11 have ridden with a drunk driver. + P(r : 11) = 5. At least 1 have ridden with a drunk driver. P(r 1) = 6. Between 2 and 4 (exclusive) have ridden with a drunk driver. P(2 : 4) V. VE
Step by Step Solution
★★★★★
3.39 Rating (152 Votes )
There are 3 Steps involved in it
Step: 1

Get Instant Access to Expert-Tailored Solutions
See step-by-step solutions with expert insights and AI powered tools for academic success
Step: 2

Step: 3

Document Format ( 2 attachments)
635dbb659066b_178403.pdf
180 KBs PDF File
635dbb659066b_178403.docx
120 KBs Word File
Ace Your Homework with AI
Get the answers you need in no time with our AI-driven, step-by-step assistance
Get Started


