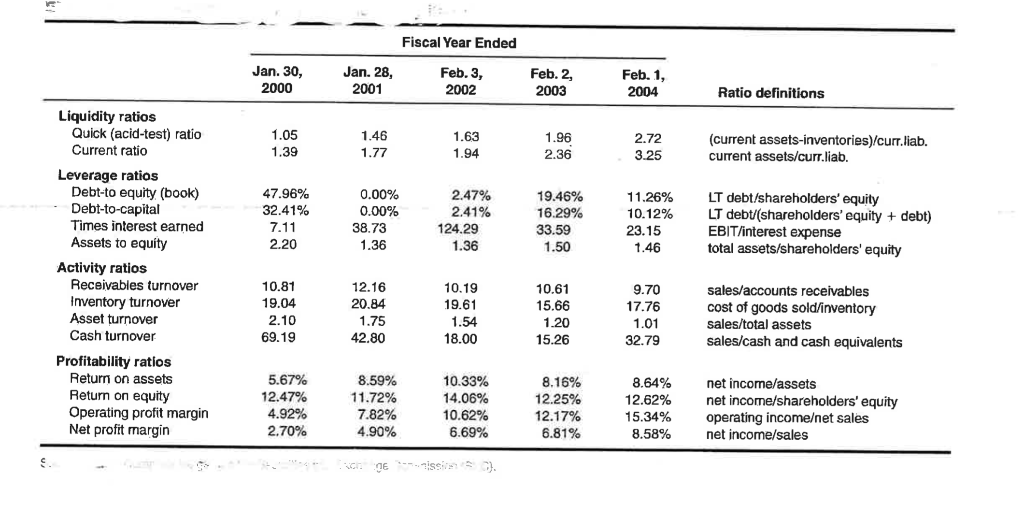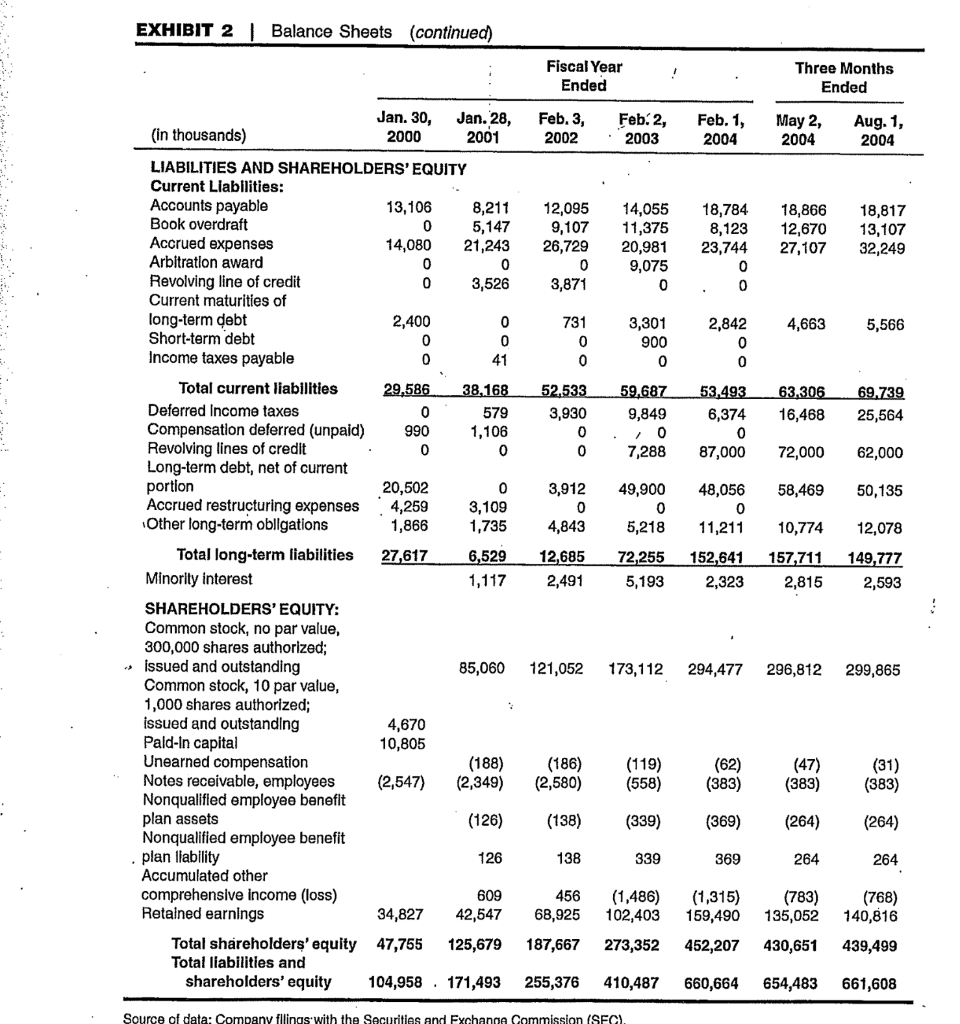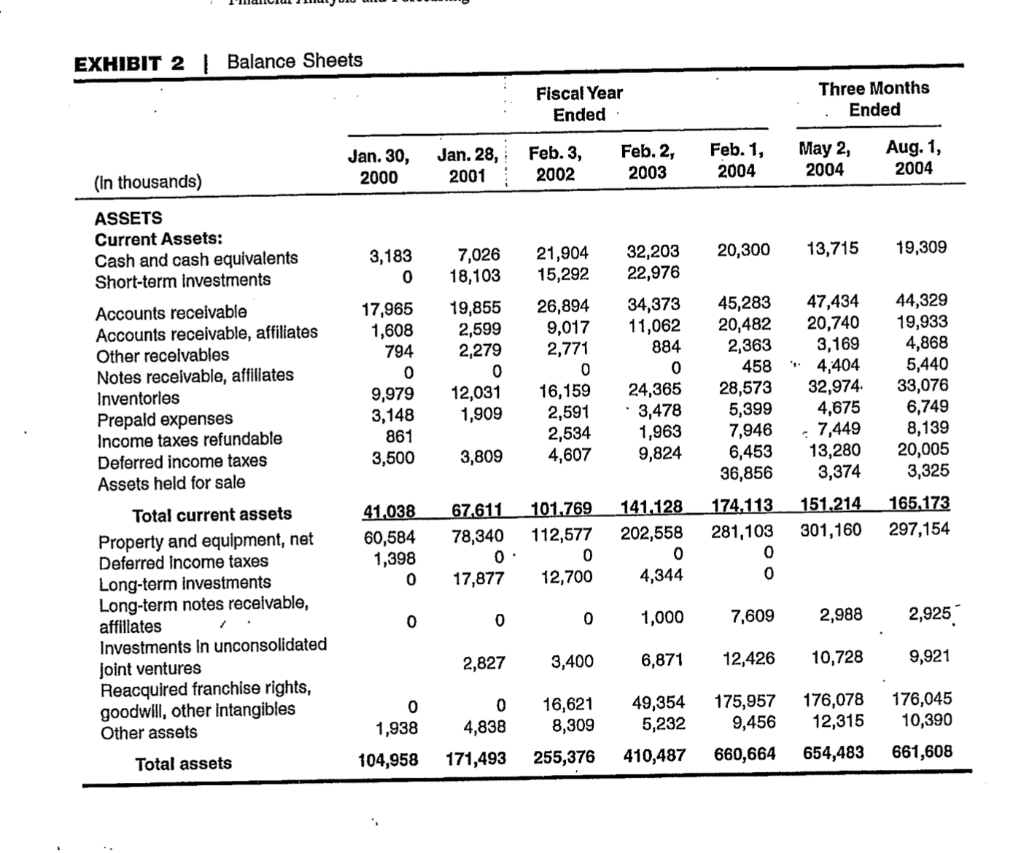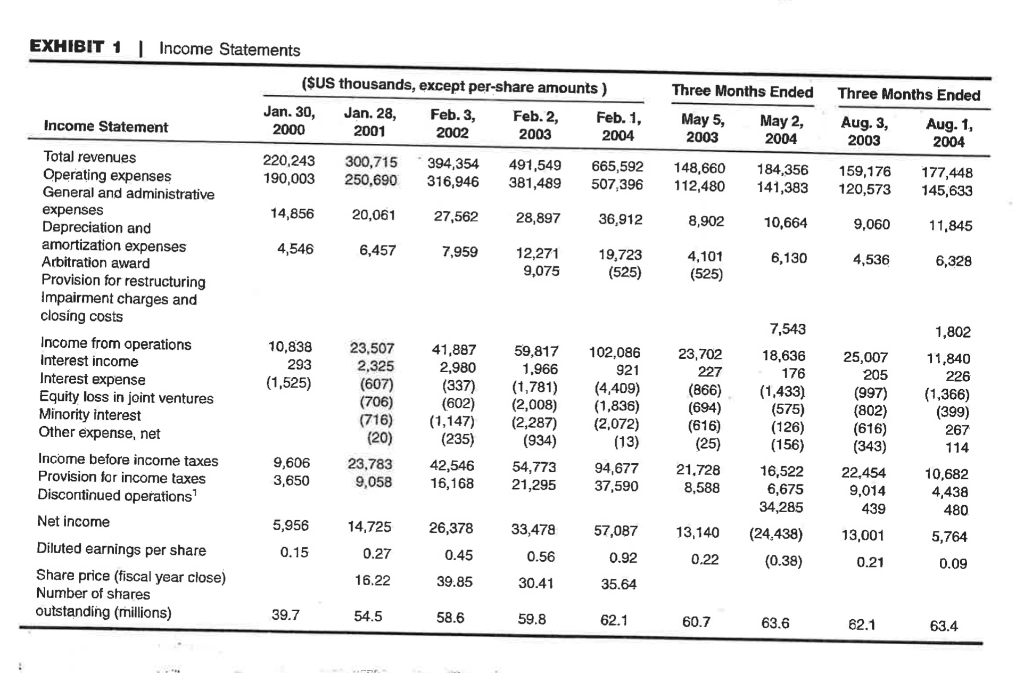


 According to the financial statements, indicate whether the company is in a healthy financial position, and the company belongs to Dog? Cashcow? Star? or? Explain
Fiscal Year Ended Jan. 30, 2000 Jan. 28, 2001 Feb. 3, Feb. 1, 2002 Feb. 2, 2003 2004 Ratio definitions 1.05 1.39 1.46 1.77 1.63 1.94 1.96 2.36 2.72 3.25 (current assets-inventories)/curr.liab. current assets/curr.liab. 47.96% 32.41% 7.11 2.20 0.00% 0.00% 38.73 1.36 2.47% 2.41% 124.29 1.36 19.46% 16.29% 33.59 1.50 11.26% 10.12% 23.15 1.46 LT debt/shareholders' equity LT debt(shareholders' equity + debt) EBIT/interest expense total assets/shareholders' equity Liquidity ratios Quick (acid-test) ratio Current ratio Leverage ratios Debt-to equity (book) Debt-to-capital Times interest earned Assets to equity Activity ratios Receivables turnover Inventory turnover Asset turnover Cash turnover Profitability ratios Return on assets Return on equity Operating profit margin Net profit margin 10.81 19.04 2.10 69.19 12.16 20.84 1.75 42.80 10.19 19.61 1.54 18.00 10.61 15.66 1.20 15.26 9.70 17.76 1.01 32.79 sales/accounts receivables cost of goods sold/inventory sales/total assets sales/cash and cash equivalents 5.67% 12.47% 4.92% 2.70% 8.59% 11.72% 7.82% 4.90% 10.33% 14.06% 10.62% 6.69% 8.16% 12.25% 12.17% 6.81% 8.64% 12.62% 15.34% 8.58% net income/assets net income/shareholders' equity operating incomeet sales net income/sales son DESS). EXHIBIT 2 Balance Sheets (continued) Fiscal Year Ended Three Months Ended Feb. 3, 2002 Feb. 2, 2003 Feb. 1, 2004 May 2, 2004 Aug. 1, 2004 12,095 9,107 26,729 0 3,871 14,055 11,375 20,981 9,075 0 18,784 8,123 23,744 0 0 18,866 12,670 27,107 18,817 13,107 32,249 2,400 4,663 5,566 731 0 0 3,301 900 0 2,842 0 0 52,533 3,930 0 0 59.687 9,849 0 7,288 53,493 6,374 0 87,000 63,306 16,468 69.739 25,564 72,000 62,000 58,469 50,135 3,912 0 4,843 49,900 0 5,218 Jan. 30, Jan. 28, (in thousands) 2000 2001 LIABILITIES AND SHAREHOLDERS' EQUITY Current Liabilities: Accounts payable 13,106 8,211 Book overdraft 0 5,147 Accrued expenses 14,080 21,243 Arbitration award 0 0 Revolving line of credit 0 3,526 Current maturities of long-term debt 0 Short-term debt 0 0 Income taxes payable 0 41 Total current liabilities 29.586 38,168 Deferred Income taxes 0 579 Compensation deferred (unpaid) 990 1,106 Revolving lines of credit 0 0 Long-term debt, net of current portion 20,502 0 Accrued restructuring expenses 4,259 3,109 Other long-term obligations 1,866 1,735 Total long-term liabilities 27,617 6,529 Minority interest 1,117 SHAREHOLDERS' EQUITY: Common stock, no par value, 300,000 shares authorized; issued and outstanding 85,060 Common stock, 10 par value, 1,000 shares authorized; issued and outstanding 4,670 Pald-in capital 10,805 Unearned compensation (188) Notes receivable, employees (2,547) (2,349) Nonqualified employee benefit plan assets (126) Nonqualified employee benefit plan liability 126 Accumulated other comprehensive income (loss) 609 Retained earnings 34,827 42,547 Total shareholders' equity 47,755 125,679 Total liabilities and shareholders' equity 104,958 . 171,493 12,078 48,056 0 11,211 152,641 2,323 12,685 2,491 72,255 5,193 10,774 157,711 2,815 149,777 2,593 121,052 173,112 294,477 296,812 299,865 (62) (186) (2,580) (119) (558) (383) (47) (383) (31) (383) (138) (339) (369) (264) (264) 138 339 369 264 264 456 68,925 (1,486) 102,403 (1,315) 159,490 452,207 (783) 135,052 (768) 140,816 187,667 273,352 430,651 439,499 255,376 410,487 660,664 654,483 661,608 Source of data: Company Ellings with the Securities and Exchange Commission (SEC). EXHIBIT 2 | Balance Sheets Fiscal Year Ended Three Months Ended Jan. 30, 2000 Jan. 28, 2001 Feb. 3, 2002 Feb. 2, 2003 Feb. 1, 2004 May 2, 2004 Aug. 1, 2004 (In thousands) 20,300 13,715 19,309 3,183 0 32,203 22,976 ASSETS Current Assets: Cash and cash equivalents Short-term Investments Accounts receivable Accounts receivable, affiliates Other receivables Notes receivable, affiliates Inventories Prepaid expenses Income taxes refundable Deferred income taxes Assets held for sale 17,965 1,608 794 0 9,979 3,148 861 3,500 7,026 18,103 19,855 2,599 2,279 0 12,031 1,909 21,904 15,292 26,894 9,017 2,771 0 16,159 2,591 2,534 4,607 34,373 11,062 884 0 24,365 3,478 1,963 9,824 45,283 20,482 2,363 458 28,573 5,399 7,946 6,453 36,856 47,434 20,740 3,169 4,404 32,974. 4,675 7,449 13,280 3,374 151,214 301,160 44,329 19,933 4,868 5,440 33,076 6,749 8,139 20,005 3,325 3,809 41,038 60,584 1,398 0 165.173 297,154 67,611 78,340 0. 17,877 101.769 112,577 0 12,700 141,128 202,558 0 4,344 174.113 281,103 0 0 0 0 0 Total current assets Property and equipment, net Deferred income taxes Long-term investments Long-term notes receivable, affiliates Investments In unconsolidated joint ventures Reacquired franchise rights, goodwill, other intangibles Other assets 1,000 7,609 2,988 2,925 2,827 3,400 6,871 12,426 10,728 9,921 0 1,938 0 4,838 171,493 16,621 8,309 49,354 5,232 410,487 175,957 9,456 660,664 176,078 12,315 654,483 176,045 10,390 104,958 Total assets 255,376 661,608 EXHIBIT 1 | Income Statements Three Months Ended Three Months Ended ($US thousands, except per-share amounts ) Jan. 30, Jan. 28, Feb. 3, Feb. 2, Feb. 1, 2000 2001 2002 2003 2004 Income Statement May 5, 2003 May 2, 2004 Aug. 3, 2003 Aug. 1, 2004 220,243 190,003 300,715 250,690 394,354 316,946 491,549 381,489 665,592 507,396 148,660 112,480 184,356 141,383 159,176 120,573 177,448 145,633 14,856 20,061 27,562 28,897 36,912 8,902 10,664 9,060 11,845 4,546 6,457 7,959 12,271 9,075 19,723 (525) 6,130 4,101 (525) 4,536 6,328 7,543 Total revenues Operating expenses General and administrative expenses Depreciation and amortization expenses Arbitration award Provision for restructuring Impairment charges and closing costs Income from operations Interest income Interest expense Equity loss in joint ventures Minority interest Other expense, net Income before income taxes Provision for income taxes Discontinued operations Net income 1,802 10,838 293 (1,525) 23,507 2,325 (607) (706) (716) (20) 23,783 9,058 41,887 2,980 (337) (602) (1,147) (235) 42,546 16,168 59,817 1,966 (1,781) (2,008) (2,287) (934) 54,773 21,295 102,086 921 (4,409) (1,836) (2,072) (13) 94,677 37,590 23,702 227 (866) (694) (616) (25) 21.728 8,588 18,636 176 (1,433) (575) (126) (156) 16,522 6,675 34,285 25,007 205 (997) (802) (616) (343) 22,454 9,014 439 11,840 226 (1,366) (399) 267 114 3,650 10,682 4,438 480 5,956 14,725 33,478 57,087 26,378 0.45 13,140 13,001 5,764 0.15 (24.438) (0.38) 0.27 0.56 0.92 0.22 0.21 0.09 Diluted earnings per share Share price (fiscal year close) Number of shares outstanding (millions) 16.22 39.85 30.41 35.64 39.7 54.5 58.6 59.8 62.1 60.7 63.6 62.1 63.4 Fiscal Year Ended Jan. 30, 2000 Jan. 28, 2001 Feb. 3, Feb. 1, 2002 Feb. 2, 2003 2004 Ratio definitions 1.05 1.39 1.46 1.77 1.63 1.94 1.96 2.36 2.72 3.25 (current assets-inventories)/curr.liab. current assets/curr.liab. 47.96% 32.41% 7.11 2.20 0.00% 0.00% 38.73 1.36 2.47% 2.41% 124.29 1.36 19.46% 16.29% 33.59 1.50 11.26% 10.12% 23.15 1.46 LT debt/shareholders' equity LT debt(shareholders' equity + debt) EBIT/interest expense total assets/shareholders' equity Liquidity ratios Quick (acid-test) ratio Current ratio Leverage ratios Debt-to equity (book) Debt-to-capital Times interest earned Assets to equity Activity ratios Receivables turnover Inventory turnover Asset turnover Cash turnover Profitability ratios Return on assets Return on equity Operating profit margin Net profit margin 10.81 19.04 2.10 69.19 12.16 20.84 1.75 42.80 10.19 19.61 1.54 18.00 10.61 15.66 1.20 15.26 9.70 17.76 1.01 32.79 sales/accounts receivables cost of goods sold/inventory sales/total assets sales/cash and cash equivalents 5.67% 12.47% 4.92% 2.70% 8.59% 11.72% 7.82% 4.90% 10.33% 14.06% 10.62% 6.69% 8.16% 12.25% 12.17% 6.81% 8.64% 12.62% 15.34% 8.58% net income/assets net income/shareholders' equity operating incomeet sales net income/sales son DESS). EXHIBIT 2 Balance Sheets (continued) Fiscal Year Ended Three Months Ended Feb. 3, 2002 Feb. 2, 2003 Feb. 1, 2004 May 2, 2004 Aug. 1, 2004 12,095 9,107 26,729 0 3,871 14,055 11,375 20,981 9,075 0 18,784 8,123 23,744 0 0 18,866 12,670 27,107 18,817 13,107 32,249 2,400 4,663 5,566 731 0 0 3,301 900 0 2,842 0 0 52,533 3,930 0 0 59.687 9,849 0 7,288 53,493 6,374 0 87,000 63,306 16,468 69.739 25,564 72,000 62,000 58,469 50,135 3,912 0 4,843 49,900 0 5,218 Jan. 30, Jan. 28, (in thousands) 2000 2001 LIABILITIES AND SHAREHOLDERS' EQUITY Current Liabilities: Accounts payable 13,106 8,211 Book overdraft 0 5,147 Accrued expenses 14,080 21,243 Arbitration award 0 0 Revolving line of credit 0 3,526 Current maturities of long-term debt 0 Short-term debt 0 0 Income taxes payable 0 41 Total current liabilities 29.586 38,168 Deferred Income taxes 0 579 Compensation deferred (unpaid) 990 1,106 Revolving lines of credit 0 0 Long-term debt, net of current portion 20,502 0 Accrued restructuring expenses 4,259 3,109 Other long-term obligations 1,866 1,735 Total long-term liabilities 27,617 6,529 Minority interest 1,117 SHAREHOLDERS' EQUITY: Common stock, no par value, 300,000 shares authorized; issued and outstanding 85,060 Common stock, 10 par value, 1,000 shares authorized; issued and outstanding 4,670 Pald-in capital 10,805 Unearned compensation (188) Notes receivable, employees (2,547) (2,349) Nonqualified employee benefit plan assets (126) Nonqualified employee benefit plan liability 126 Accumulated other comprehensive income (loss) 609 Retained earnings 34,827 42,547 Total shareholders' equity 47,755 125,679 Total liabilities and shareholders' equity 104,958 . 171,493 12,078 48,056 0 11,211 152,641 2,323 12,685 2,491 72,255 5,193 10,774 157,711 2,815 149,777 2,593 121,052 173,112 294,477 296,812 299,865 (62) (186) (2,580) (119) (558) (383) (47) (383) (31) (383) (138) (339) (369) (264) (264) 138 339 369 264 264 456 68,925 (1,486) 102,403 (1,315) 159,490 452,207 (783) 135,052 (768) 140,816 187,667 273,352 430,651 439,499 255,376 410,487 660,664 654,483 661,608 Source of data: Company Ellings with the Securities and Exchange Commission (SEC). EXHIBIT 2 | Balance Sheets Fiscal Year Ended Three Months Ended Jan. 30, 2000 Jan. 28, 2001 Feb. 3, 2002 Feb. 2, 2003 Feb. 1, 2004 May 2, 2004 Aug. 1, 2004 (In thousands) 20,300 13,715 19,309 3,183 0 32,203 22,976 ASSETS Current Assets: Cash and cash equivalents Short-term Investments Accounts receivable Accounts receivable, affiliates Other receivables Notes receivable, affiliates Inventories Prepaid expenses Income taxes refundable Deferred income taxes Assets held for sale 17,965 1,608 794 0 9,979 3,148 861 3,500 7,026 18,103 19,855 2,599 2,279 0 12,031 1,909 21,904 15,292 26,894 9,017 2,771 0 16,159 2,591 2,534 4,607 34,373 11,062 884 0 24,365 3,478 1,963 9,824 45,283 20,482 2,363 458 28,573 5,399 7,946 6,453 36,856 47,434 20,740 3,169 4,404 32,974. 4,675 7,449 13,280 3,374 151,214 301,160 44,329 19,933 4,868 5,440 33,076 6,749 8,139 20,005 3,325 3,809 41,038 60,584 1,398 0 165.173 297,154 67,611 78,340 0. 17,877 101.769 112,577 0 12,700 141,128 202,558 0 4,344 174.113 281,103 0 0 0 0 0 Total current assets Property and equipment, net Deferred income taxes Long-term investments Long-term notes receivable, affiliates Investments In unconsolidated joint ventures Reacquired franchise rights, goodwill, other intangibles Other assets 1,000 7,609 2,988 2,925 2,827 3,400 6,871 12,426 10,728 9,921 0 1,938 0 4,838 171,493 16,621 8,309 49,354 5,232 410,487 175,957 9,456 660,664 176,078 12,315 654,483 176,045 10,390 104,958 Total assets 255,376 661,608 EXHIBIT 1 | Income Statements Three Months Ended Three Months Ended ($US thousands, except per-share amounts ) Jan. 30, Jan. 28, Feb. 3, Feb. 2, Feb. 1, 2000 2001 2002 2003 2004 Income Statement May 5, 2003 May 2, 2004 Aug. 3, 2003 Aug. 1, 2004 220,243 190,003 300,715 250,690 394,354 316,946 491,549 381,489 665,592 507,396 148,660 112,480 184,356 141,383 159,176 120,573 177,448 145,633 14,856 20,061 27,562 28,897 36,912 8,902 10,664 9,060 11,845 4,546 6,457 7,959 12,271 9,075 19,723 (525) 6,130 4,101 (525) 4,536 6,328 7,543 Total revenues Operating expenses General and administrative expenses Depreciation and amortization expenses Arbitration award Provision for restructuring Impairment charges and closing costs Income from operations Interest income Interest expense Equity loss in joint ventures Minority interest Other expense, net Income before income taxes Provision for income taxes Discontinued operations Net income 1,802 10,838 293 (1,525) 23,507 2,325 (607) (706) (716) (20) 23,783 9,058 41,887 2,980 (337) (602) (1,147) (235) 42,546 16,168 59,817 1,966 (1,781) (2,008) (2,287) (934) 54,773 21,295 102,086 921 (4,409) (1,836) (2,072) (13) 94,677 37,590 23,702 227 (866) (694) (616) (25) 21.728 8,588 18,636 176 (1,433) (575) (126) (156) 16,522 6,675 34,285 25,007 205 (997) (802) (616) (343) 22,454 9,014 439 11,840 226 (1,366) (399) 267 114 3,650 10,682 4,438 480 5,956 14,725 33,478 57,087 26,378 0.45 13,140 13,001 5,764 0.15 (24.438) (0.38) 0.27 0.56 0.92 0.22 0.21 0.09 Diluted earnings per share Share price (fiscal year close) Number of shares outstanding (millions) 16.22 39.85 30.41 35.64 39.7 54.5 58.6 59.8 62.1 60.7 63.6 62.1 63.4


 According to the financial statements, indicate whether the company is in a healthy financial position, and the company belongs to Dog? Cashcow? Star? or? Explain


