Answered step by step
Verified Expert Solution
Question
1 Approved Answer
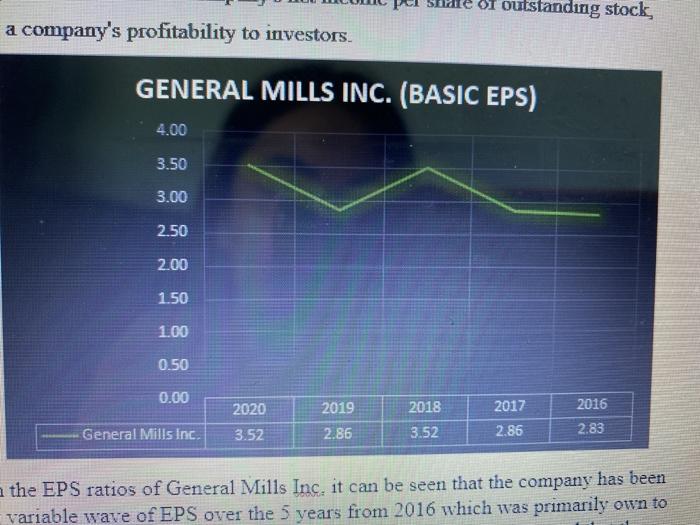
according to this picture, explain EPS in General Mills Inc and explain this chart during these years. of outstanding stock a company's profitability to investors.

according to this picture, explain EPS in General Mills Inc and explain this chart during these years.
of outstanding stock a company's profitability to investors. GENERAL MILLS INC. (BASIC EPS) 4.00 3.50 3.00 2.50 2.00 1.50 1.00 0.50 0.00 2020 2019 2018 2016 2017 2.86 General Mills Inc. 3.52 2.86 3.52 2.83 the EPS ratios of General Mills Inc, it can be seen that the company has been variable wave of EPS over the 5 vears from 2016 which was primarily own to Step by Step Solution
There are 3 Steps involved in it
Step: 1

Get Instant Access to Expert-Tailored Solutions
See step-by-step solutions with expert insights and AI powered tools for academic success
Step: 2

Step: 3

Ace Your Homework with AI
Get the answers you need in no time with our AI-driven, step-by-step assistance
Get Started


