Account Activity State University 0:04:08 elapsed X Question 1 (1 point) Listen 10/00 5.00 4.00 6.00 8.00 10.00 Level of obesity Look at the scatterplot.
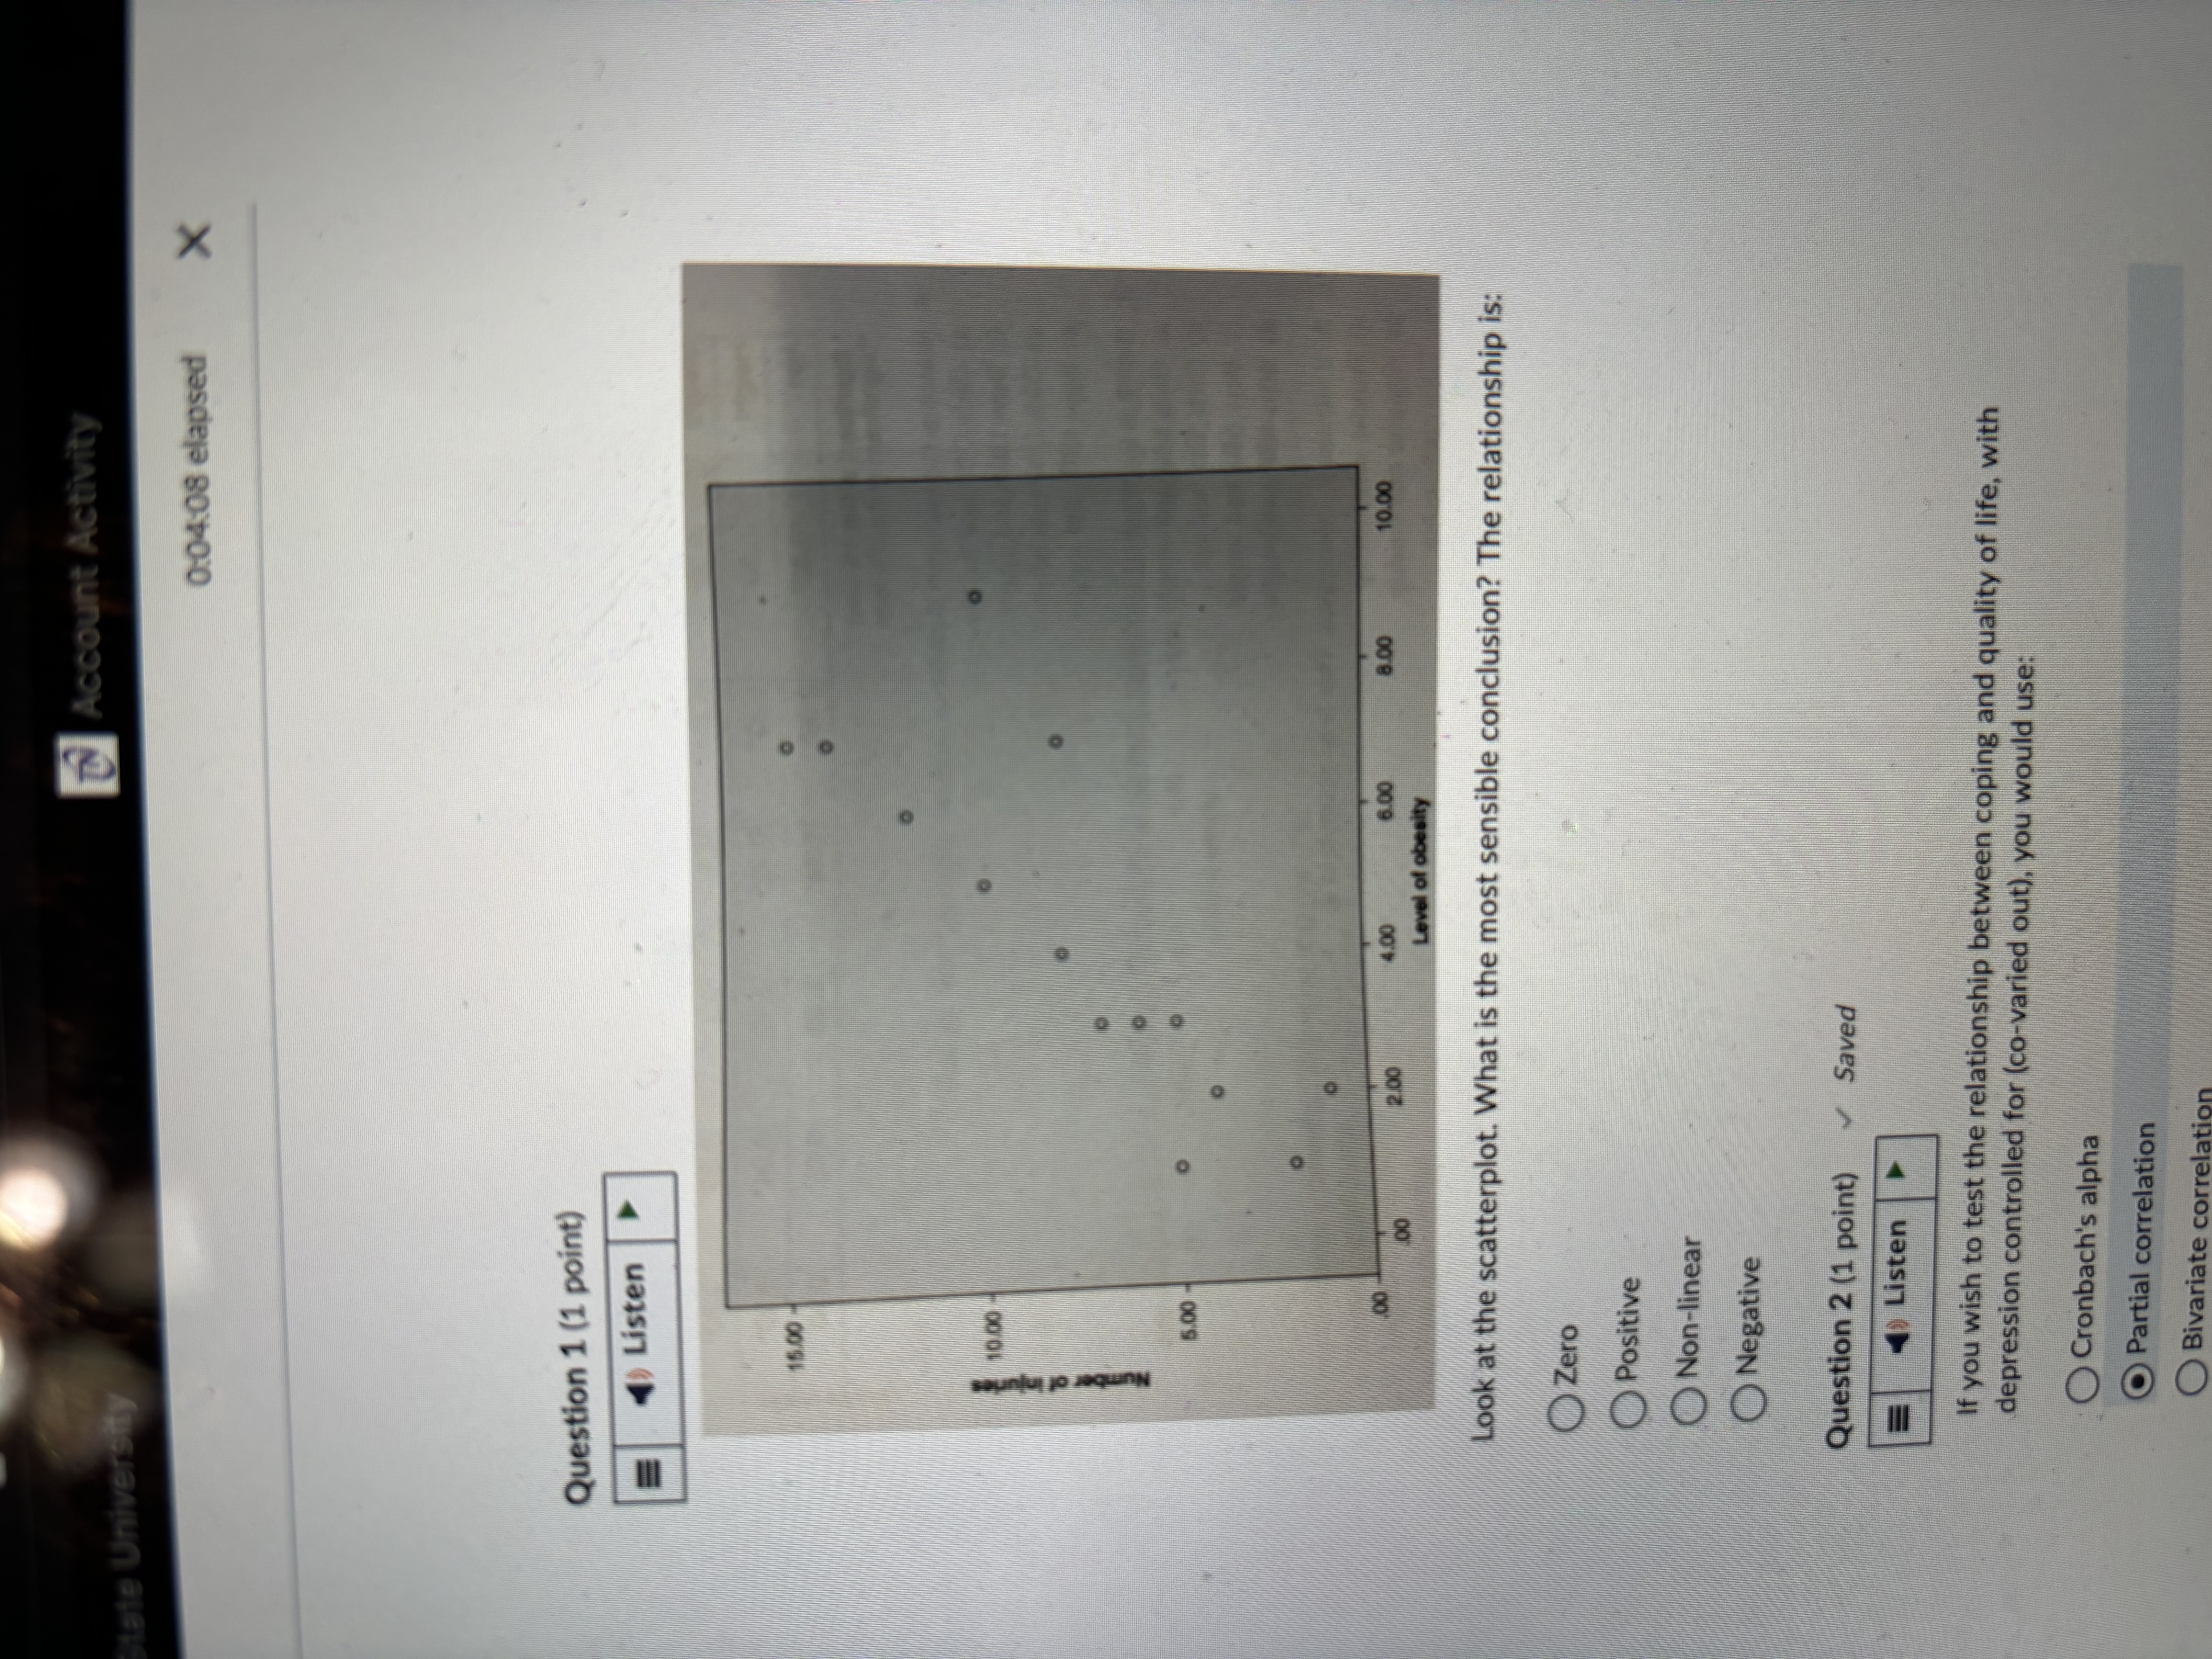
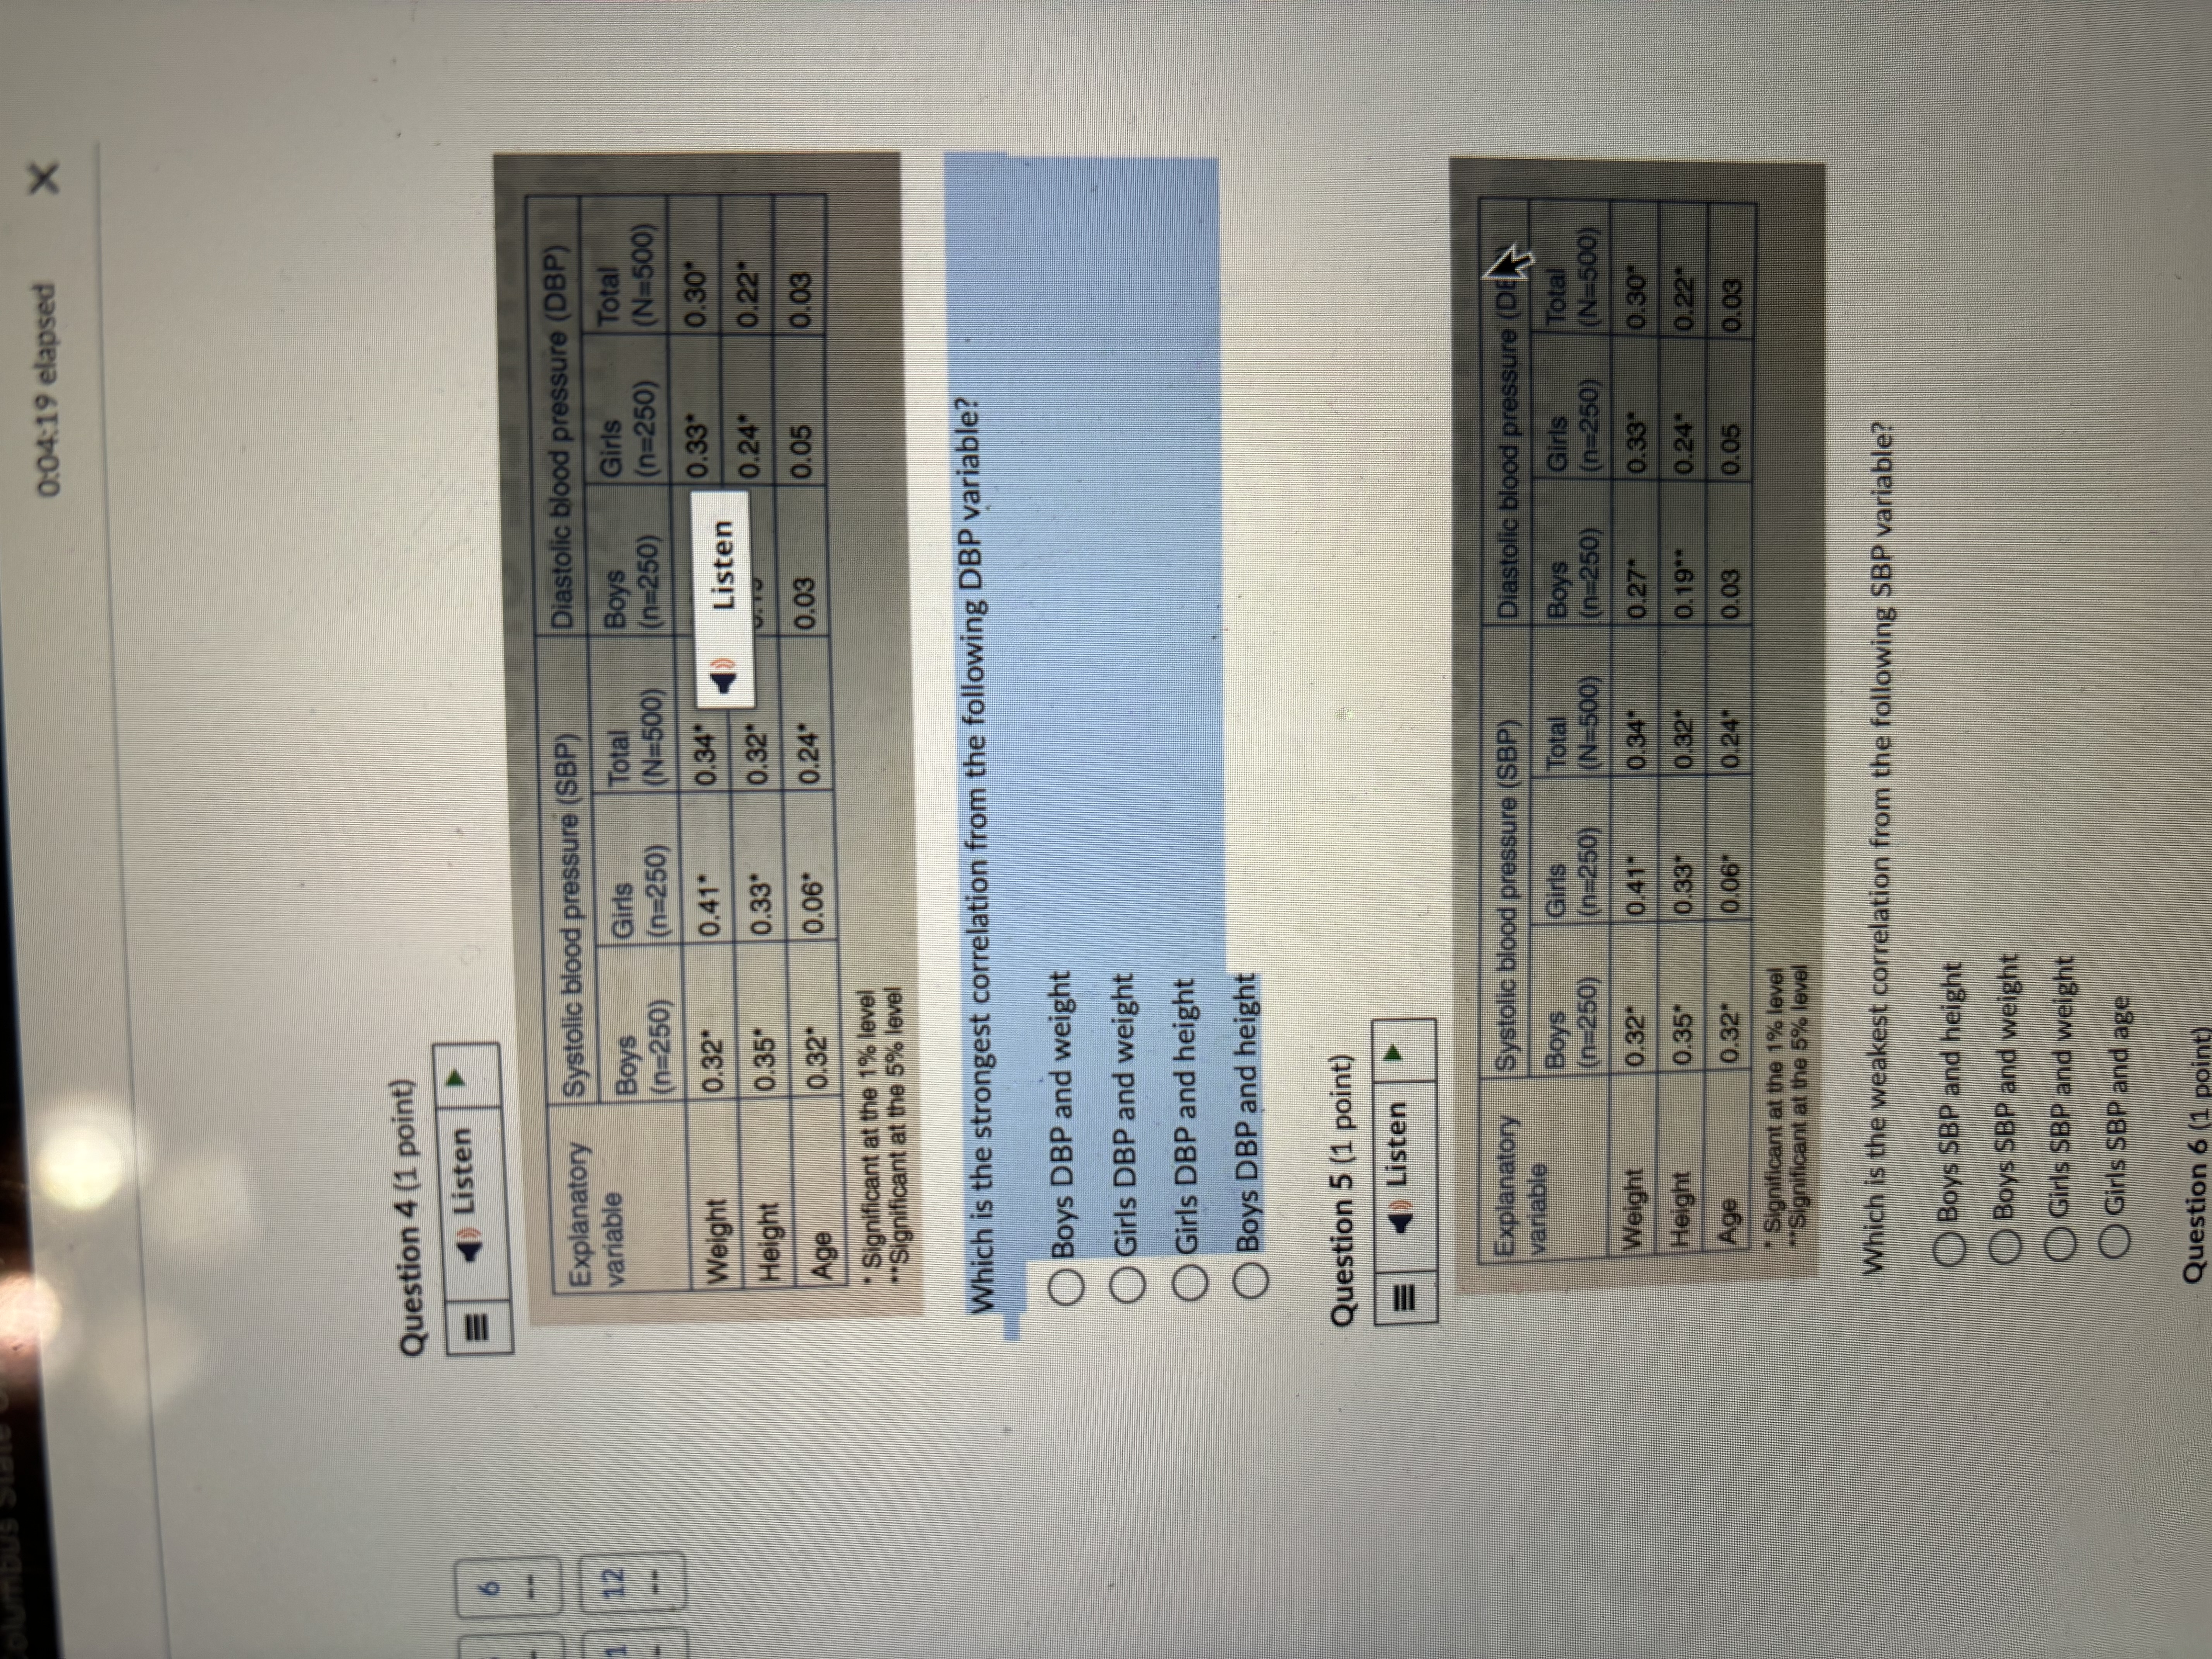
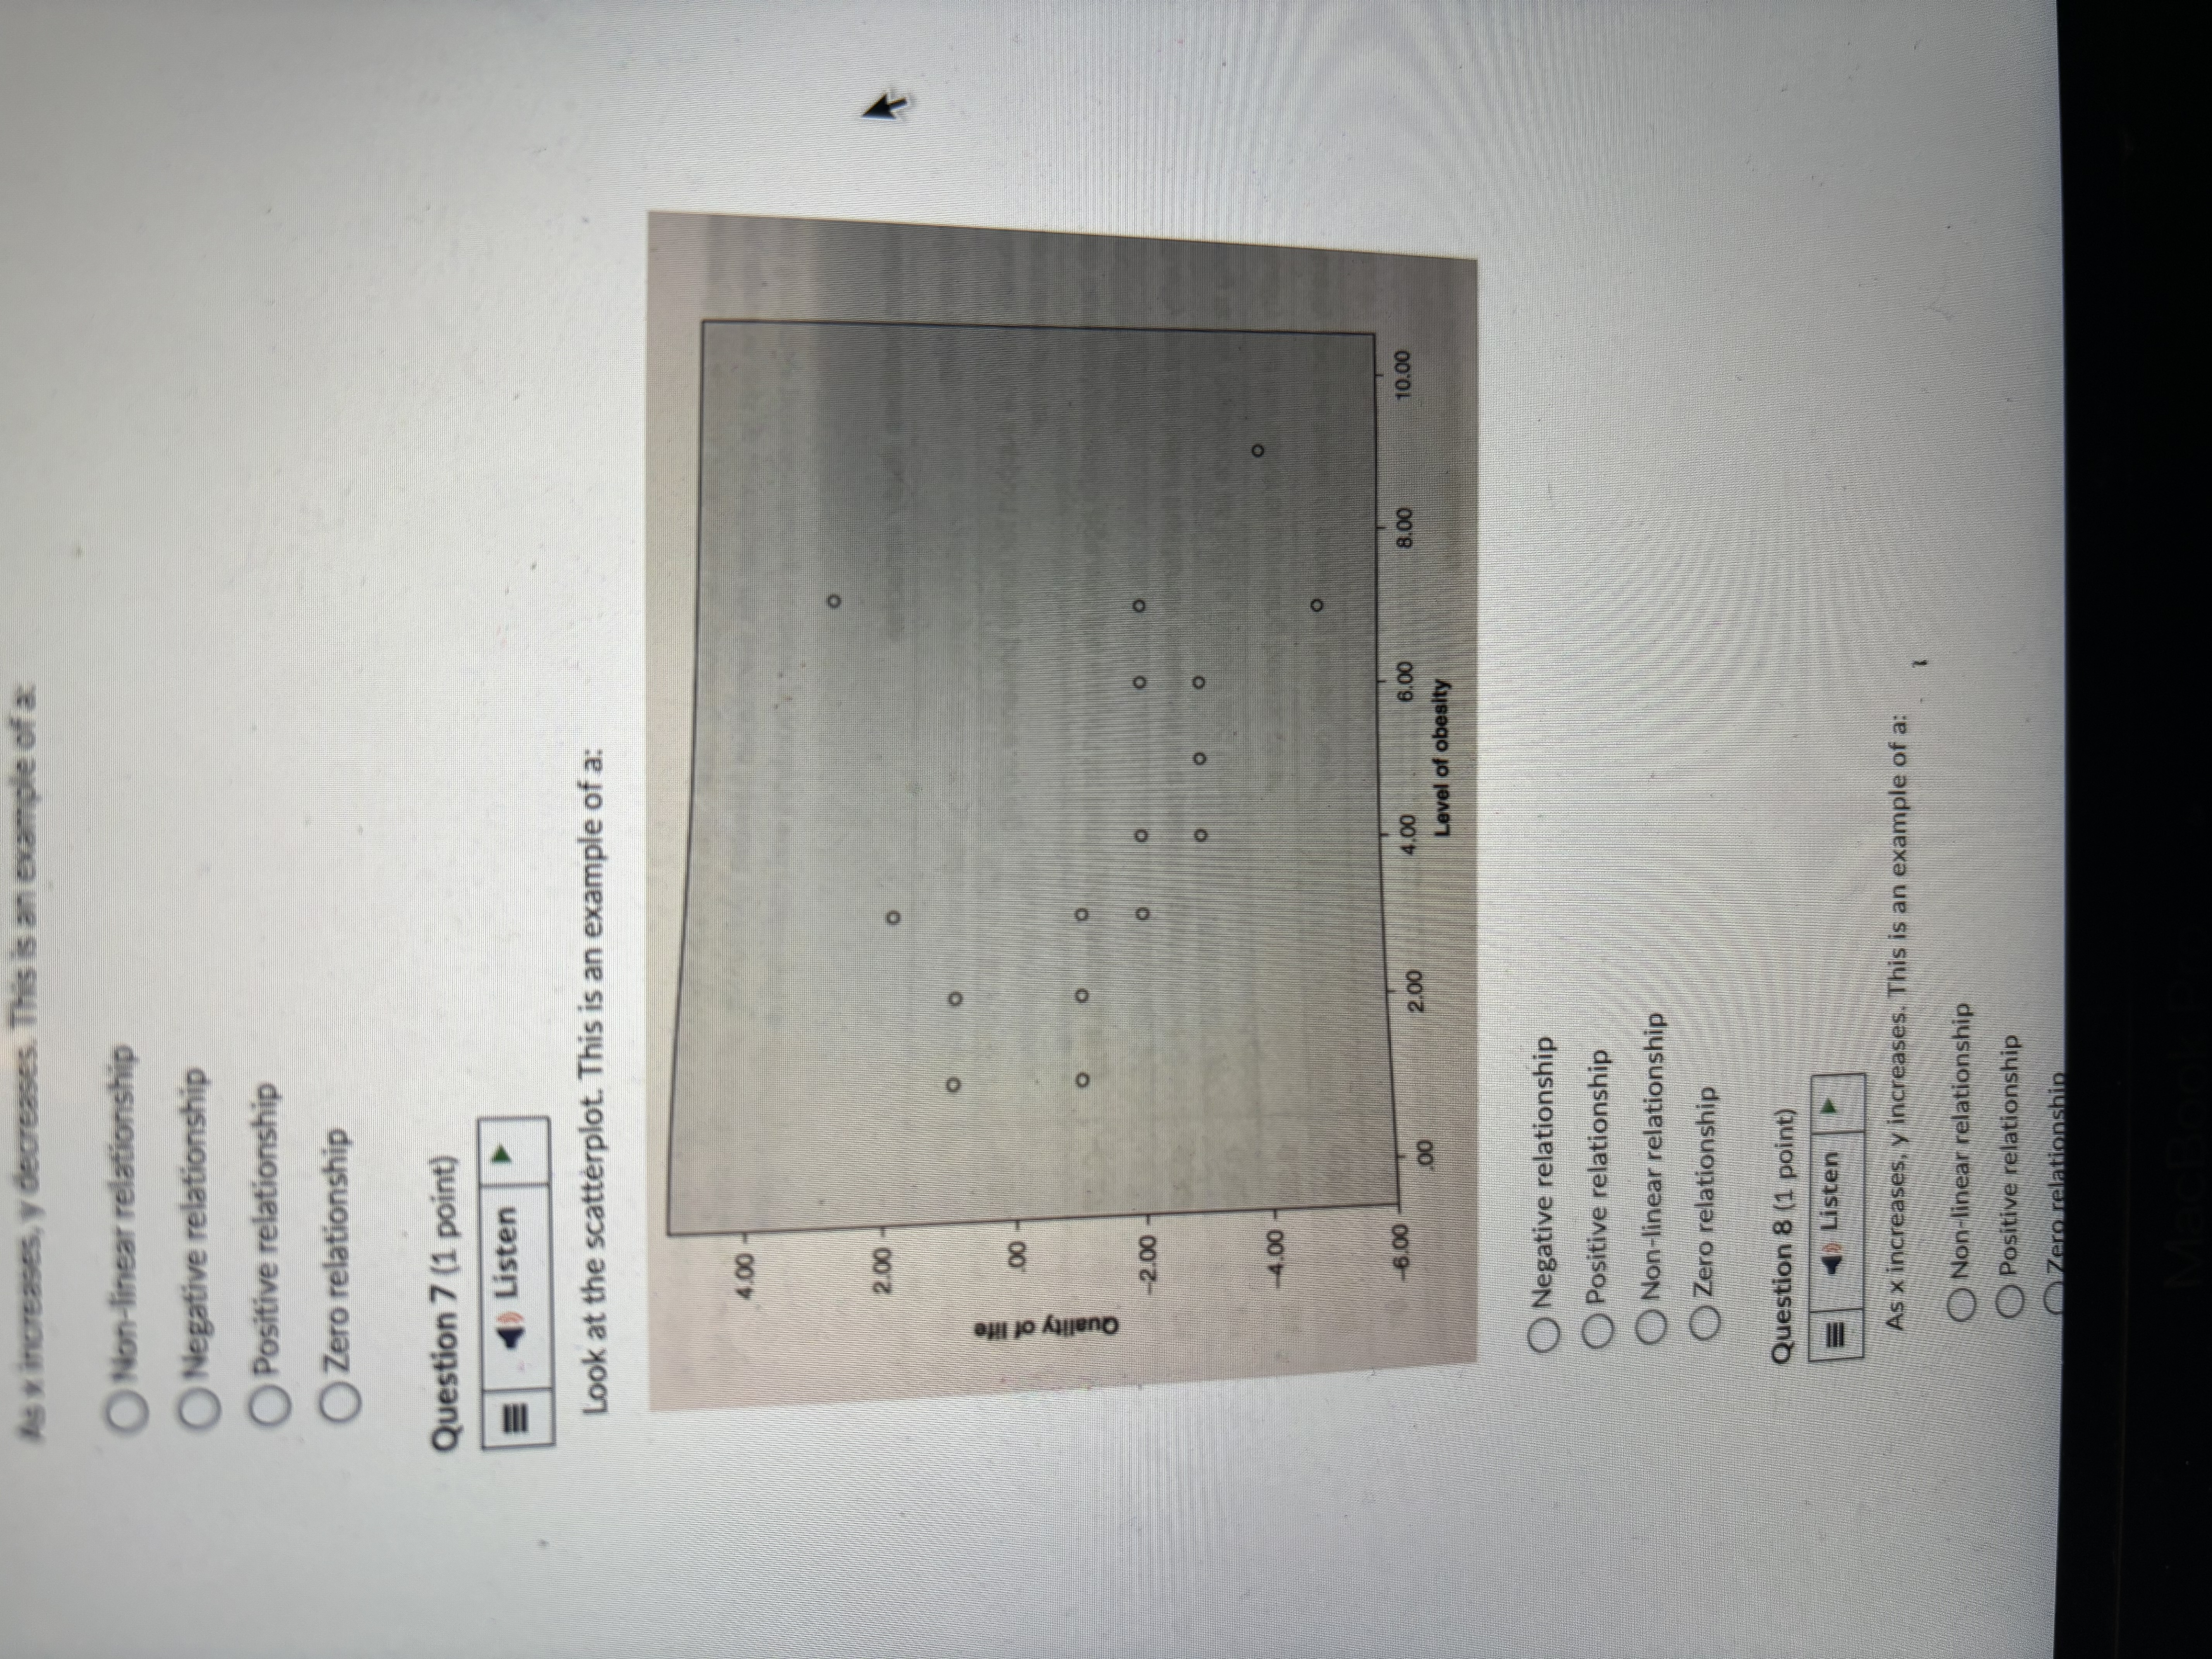
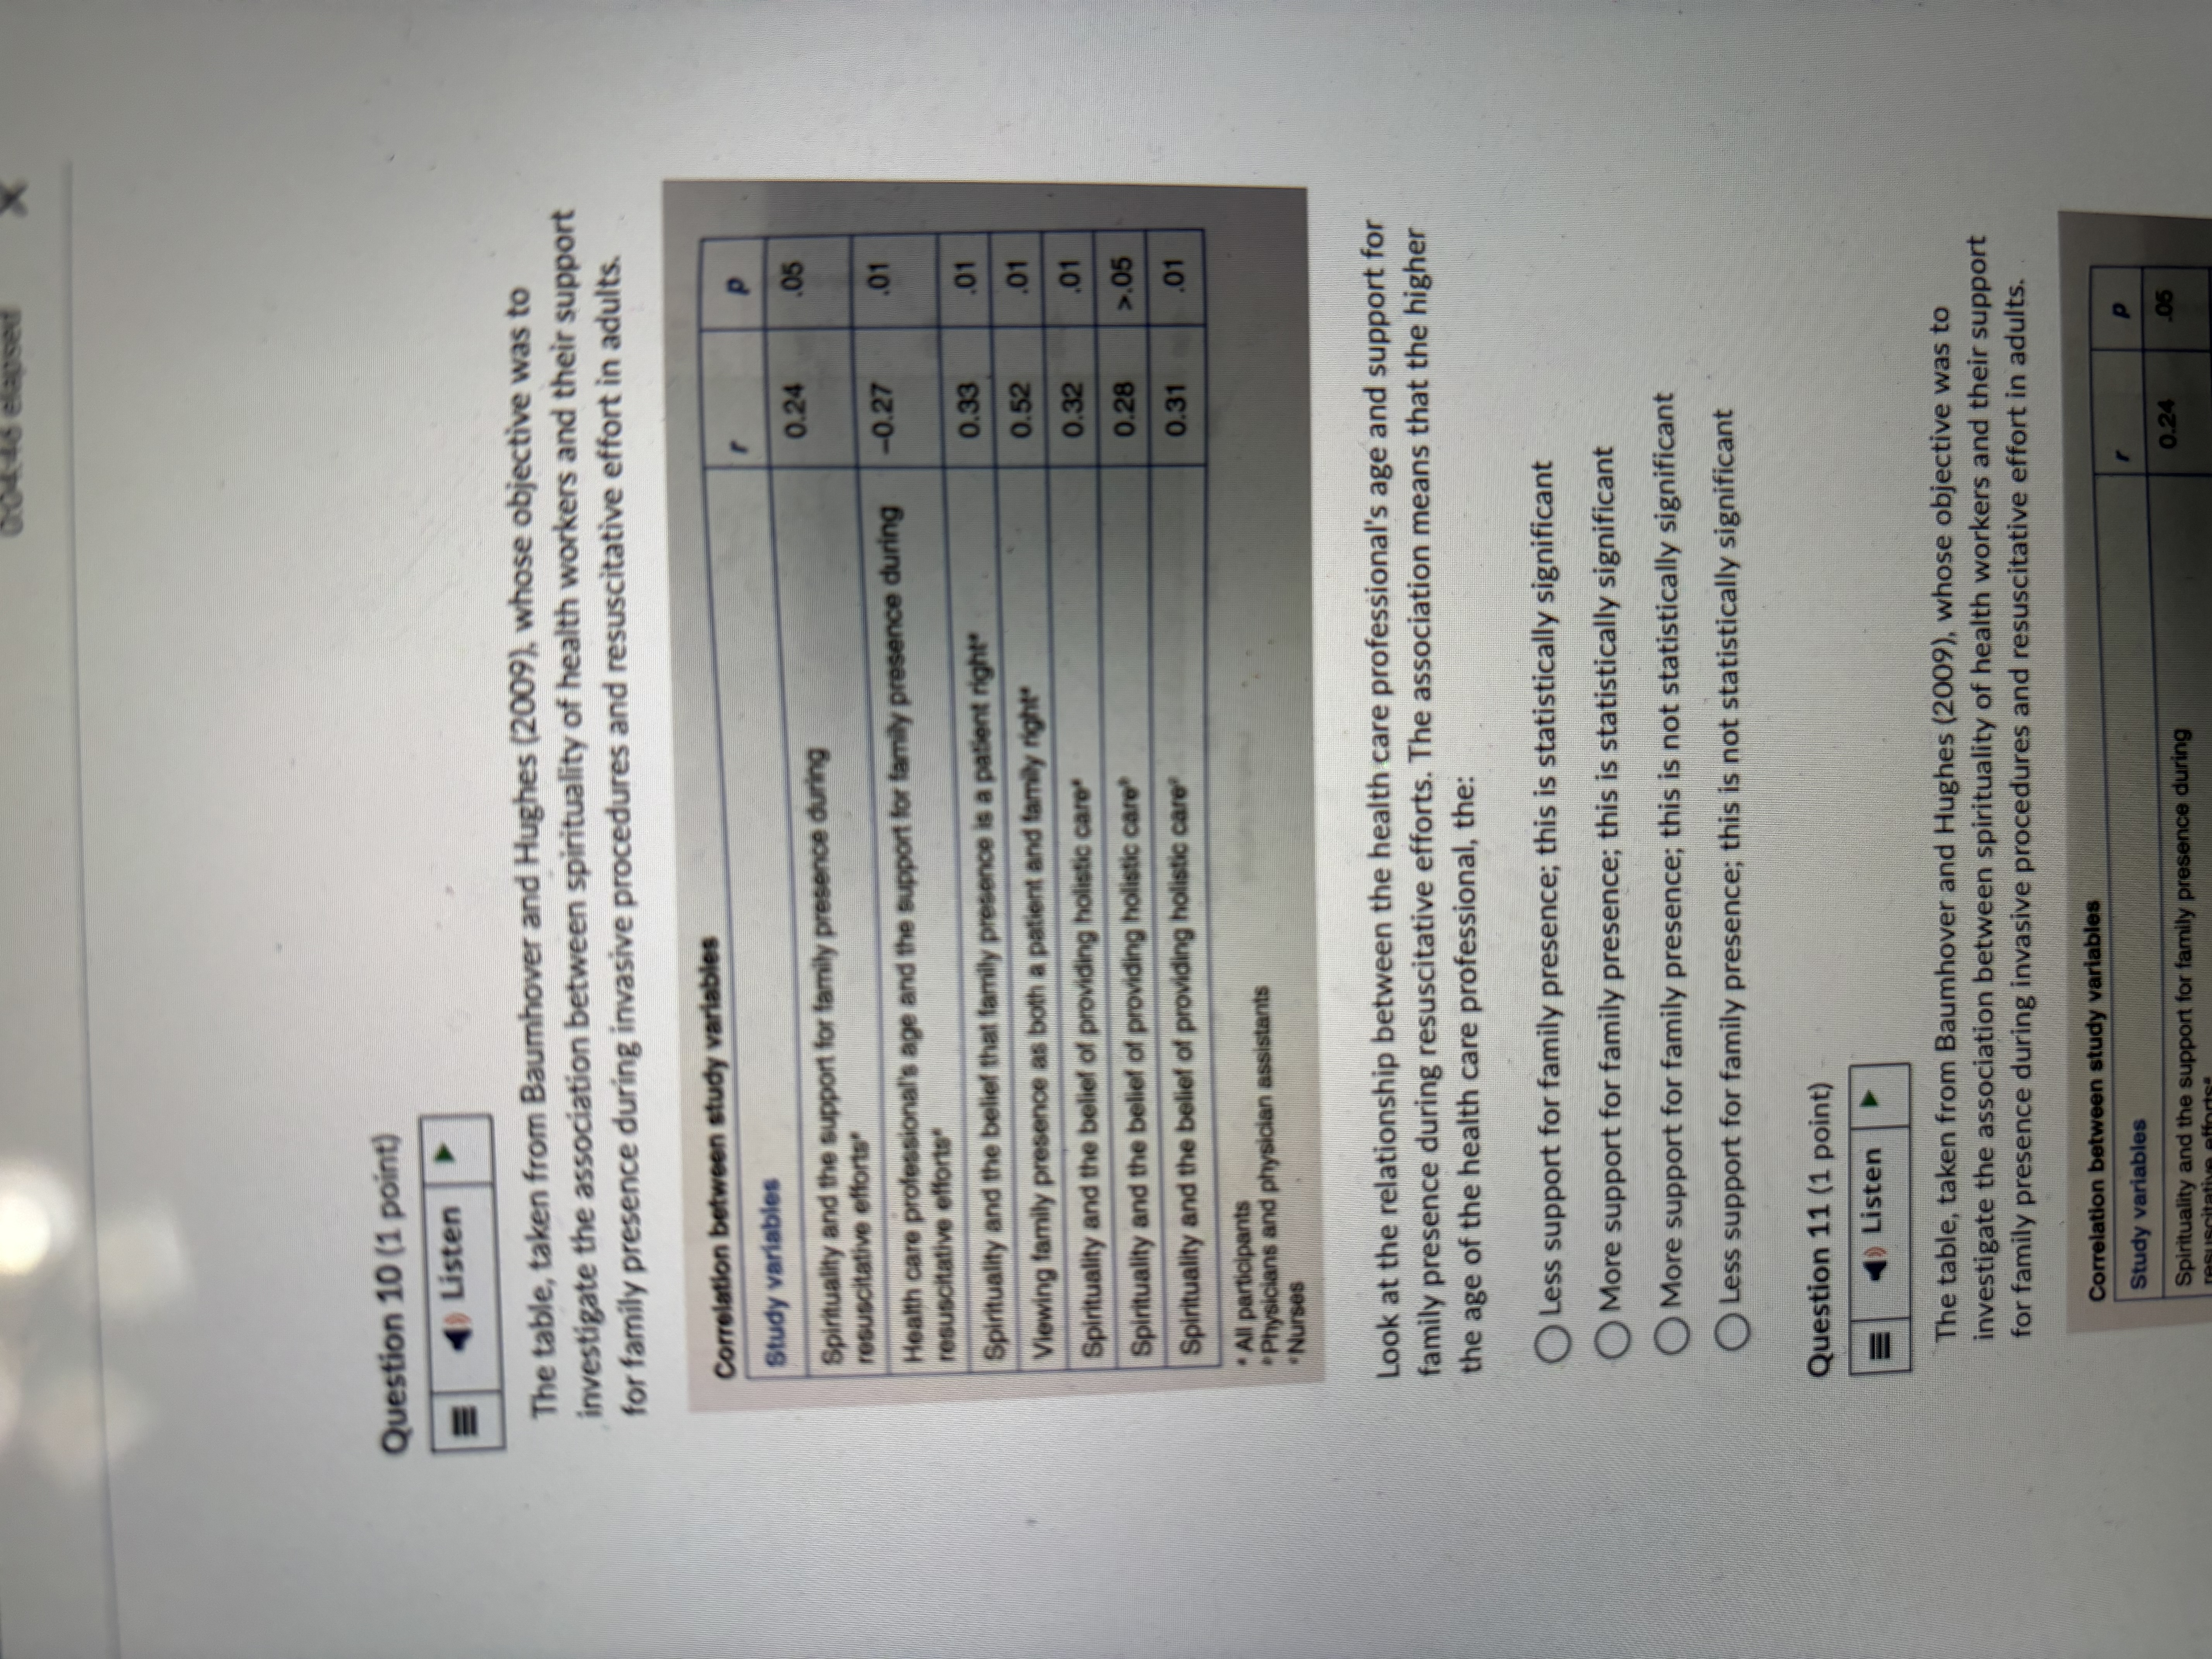
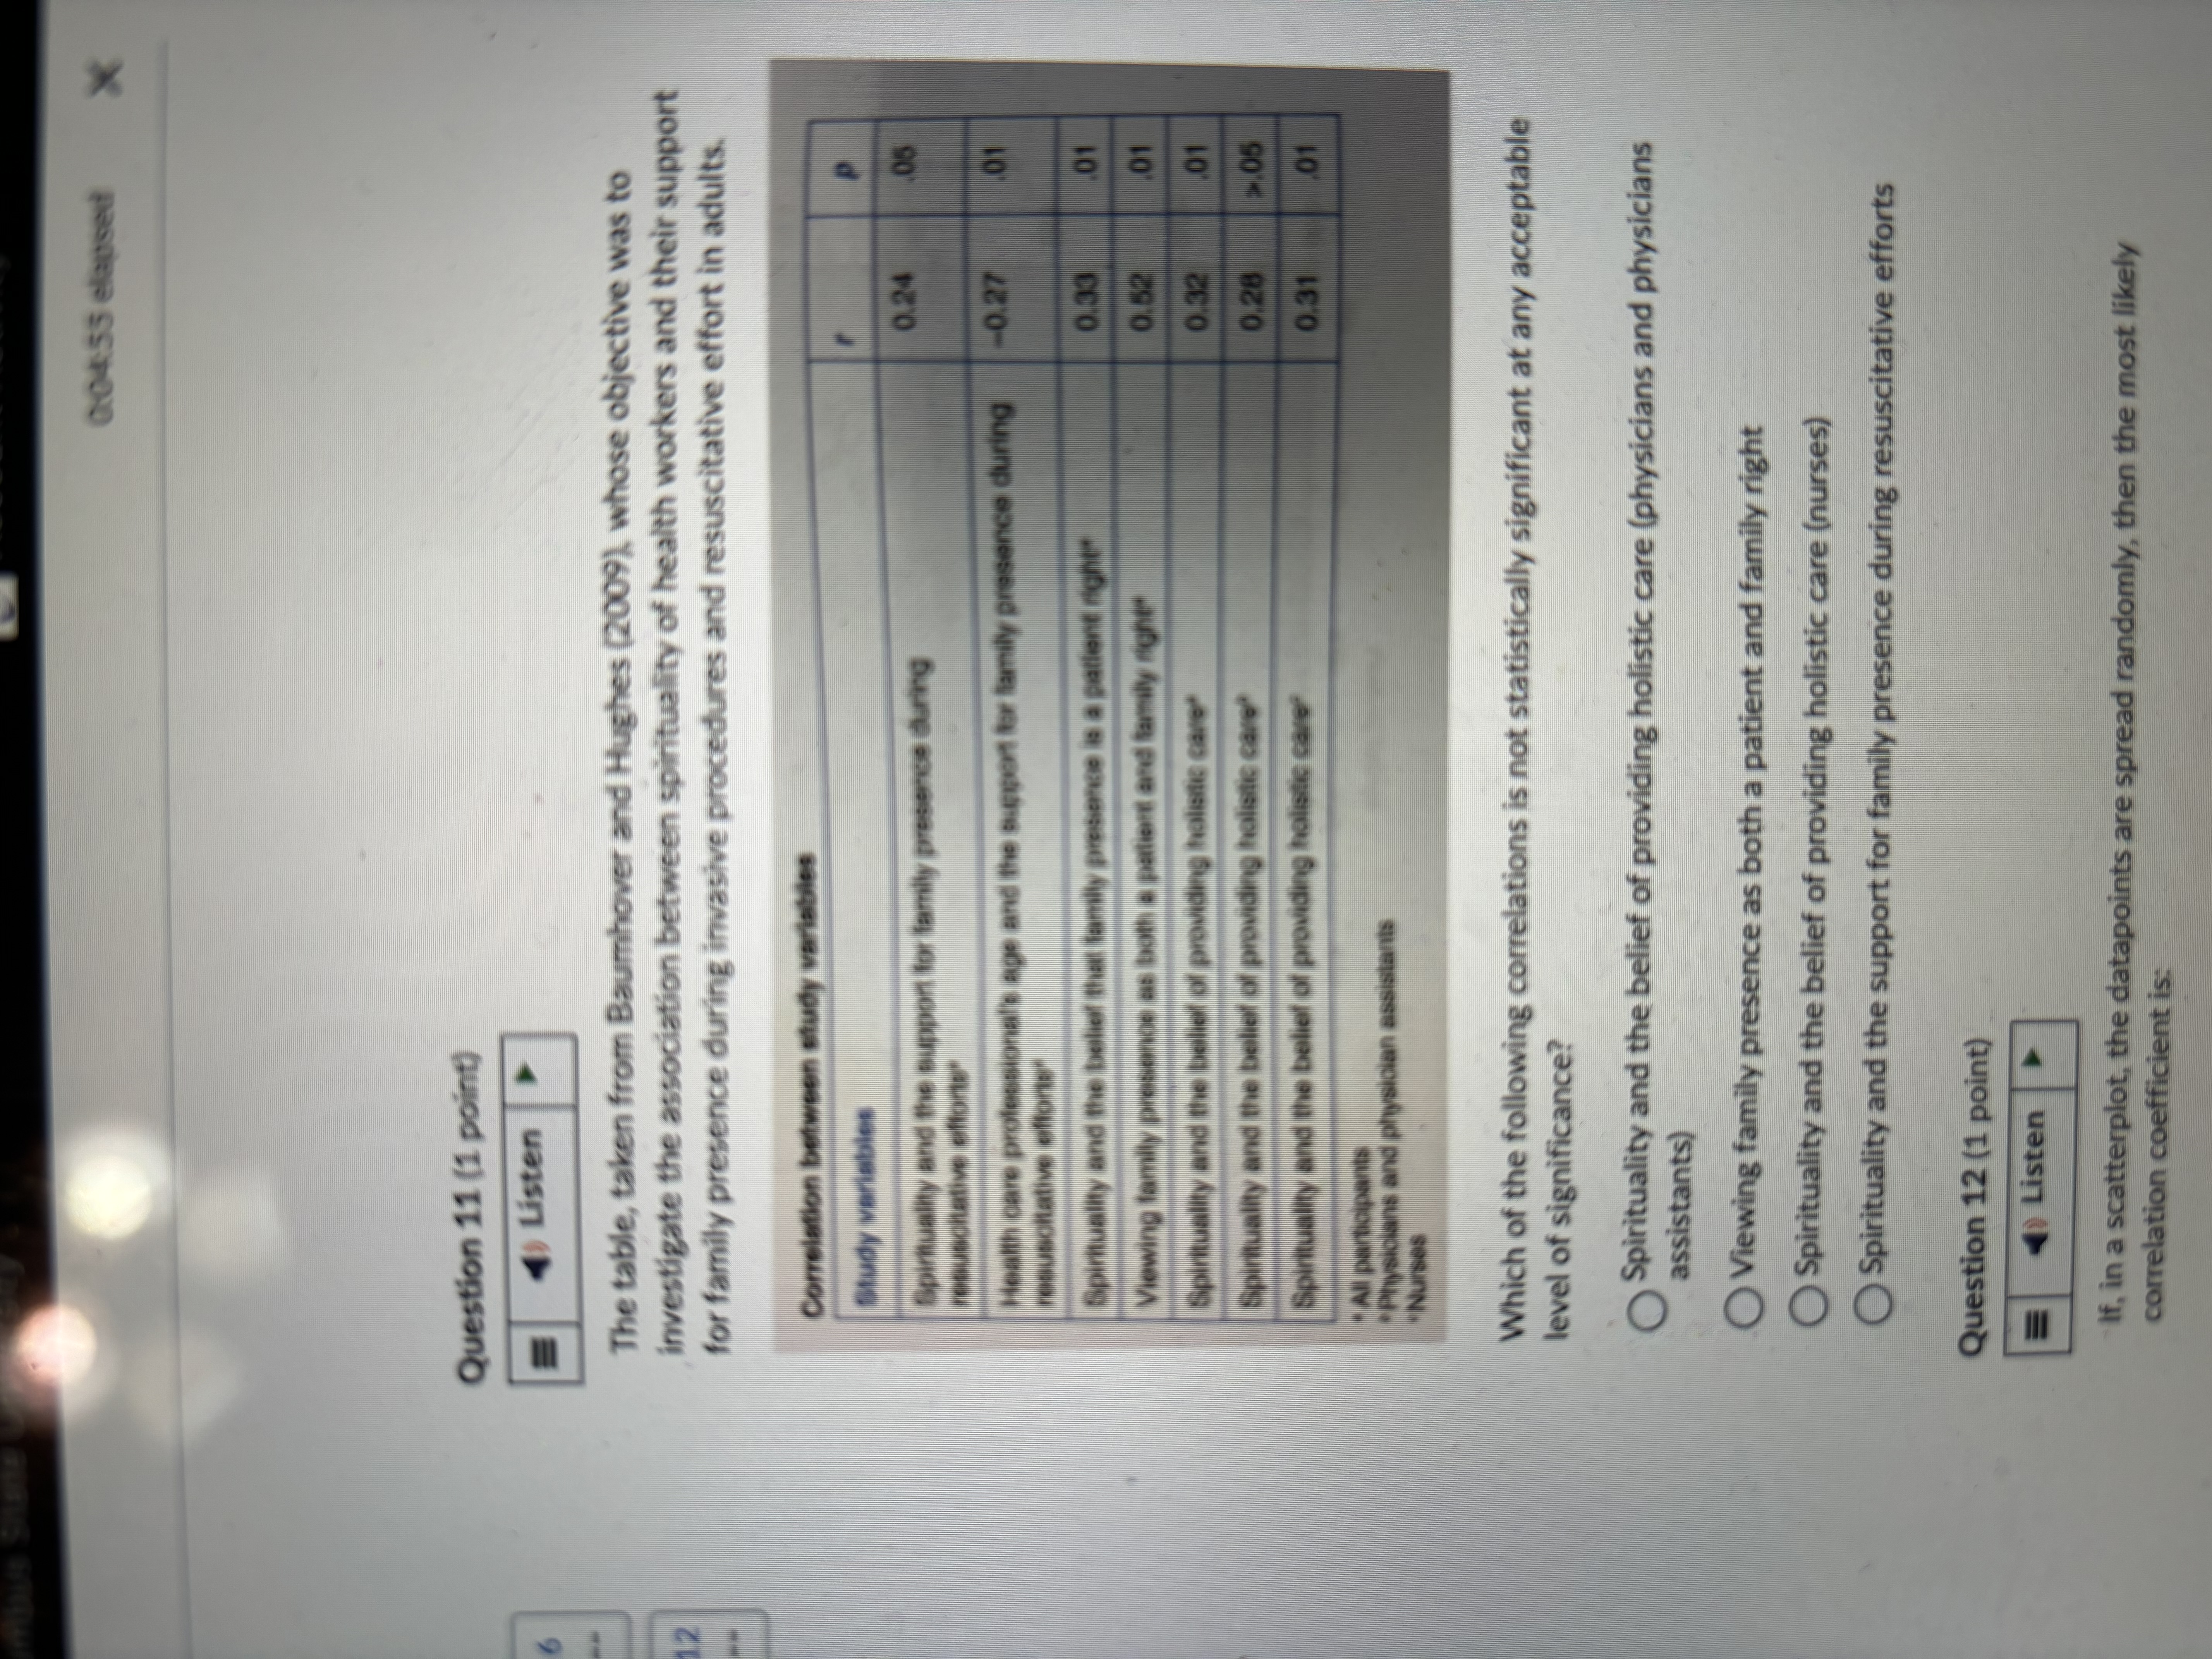
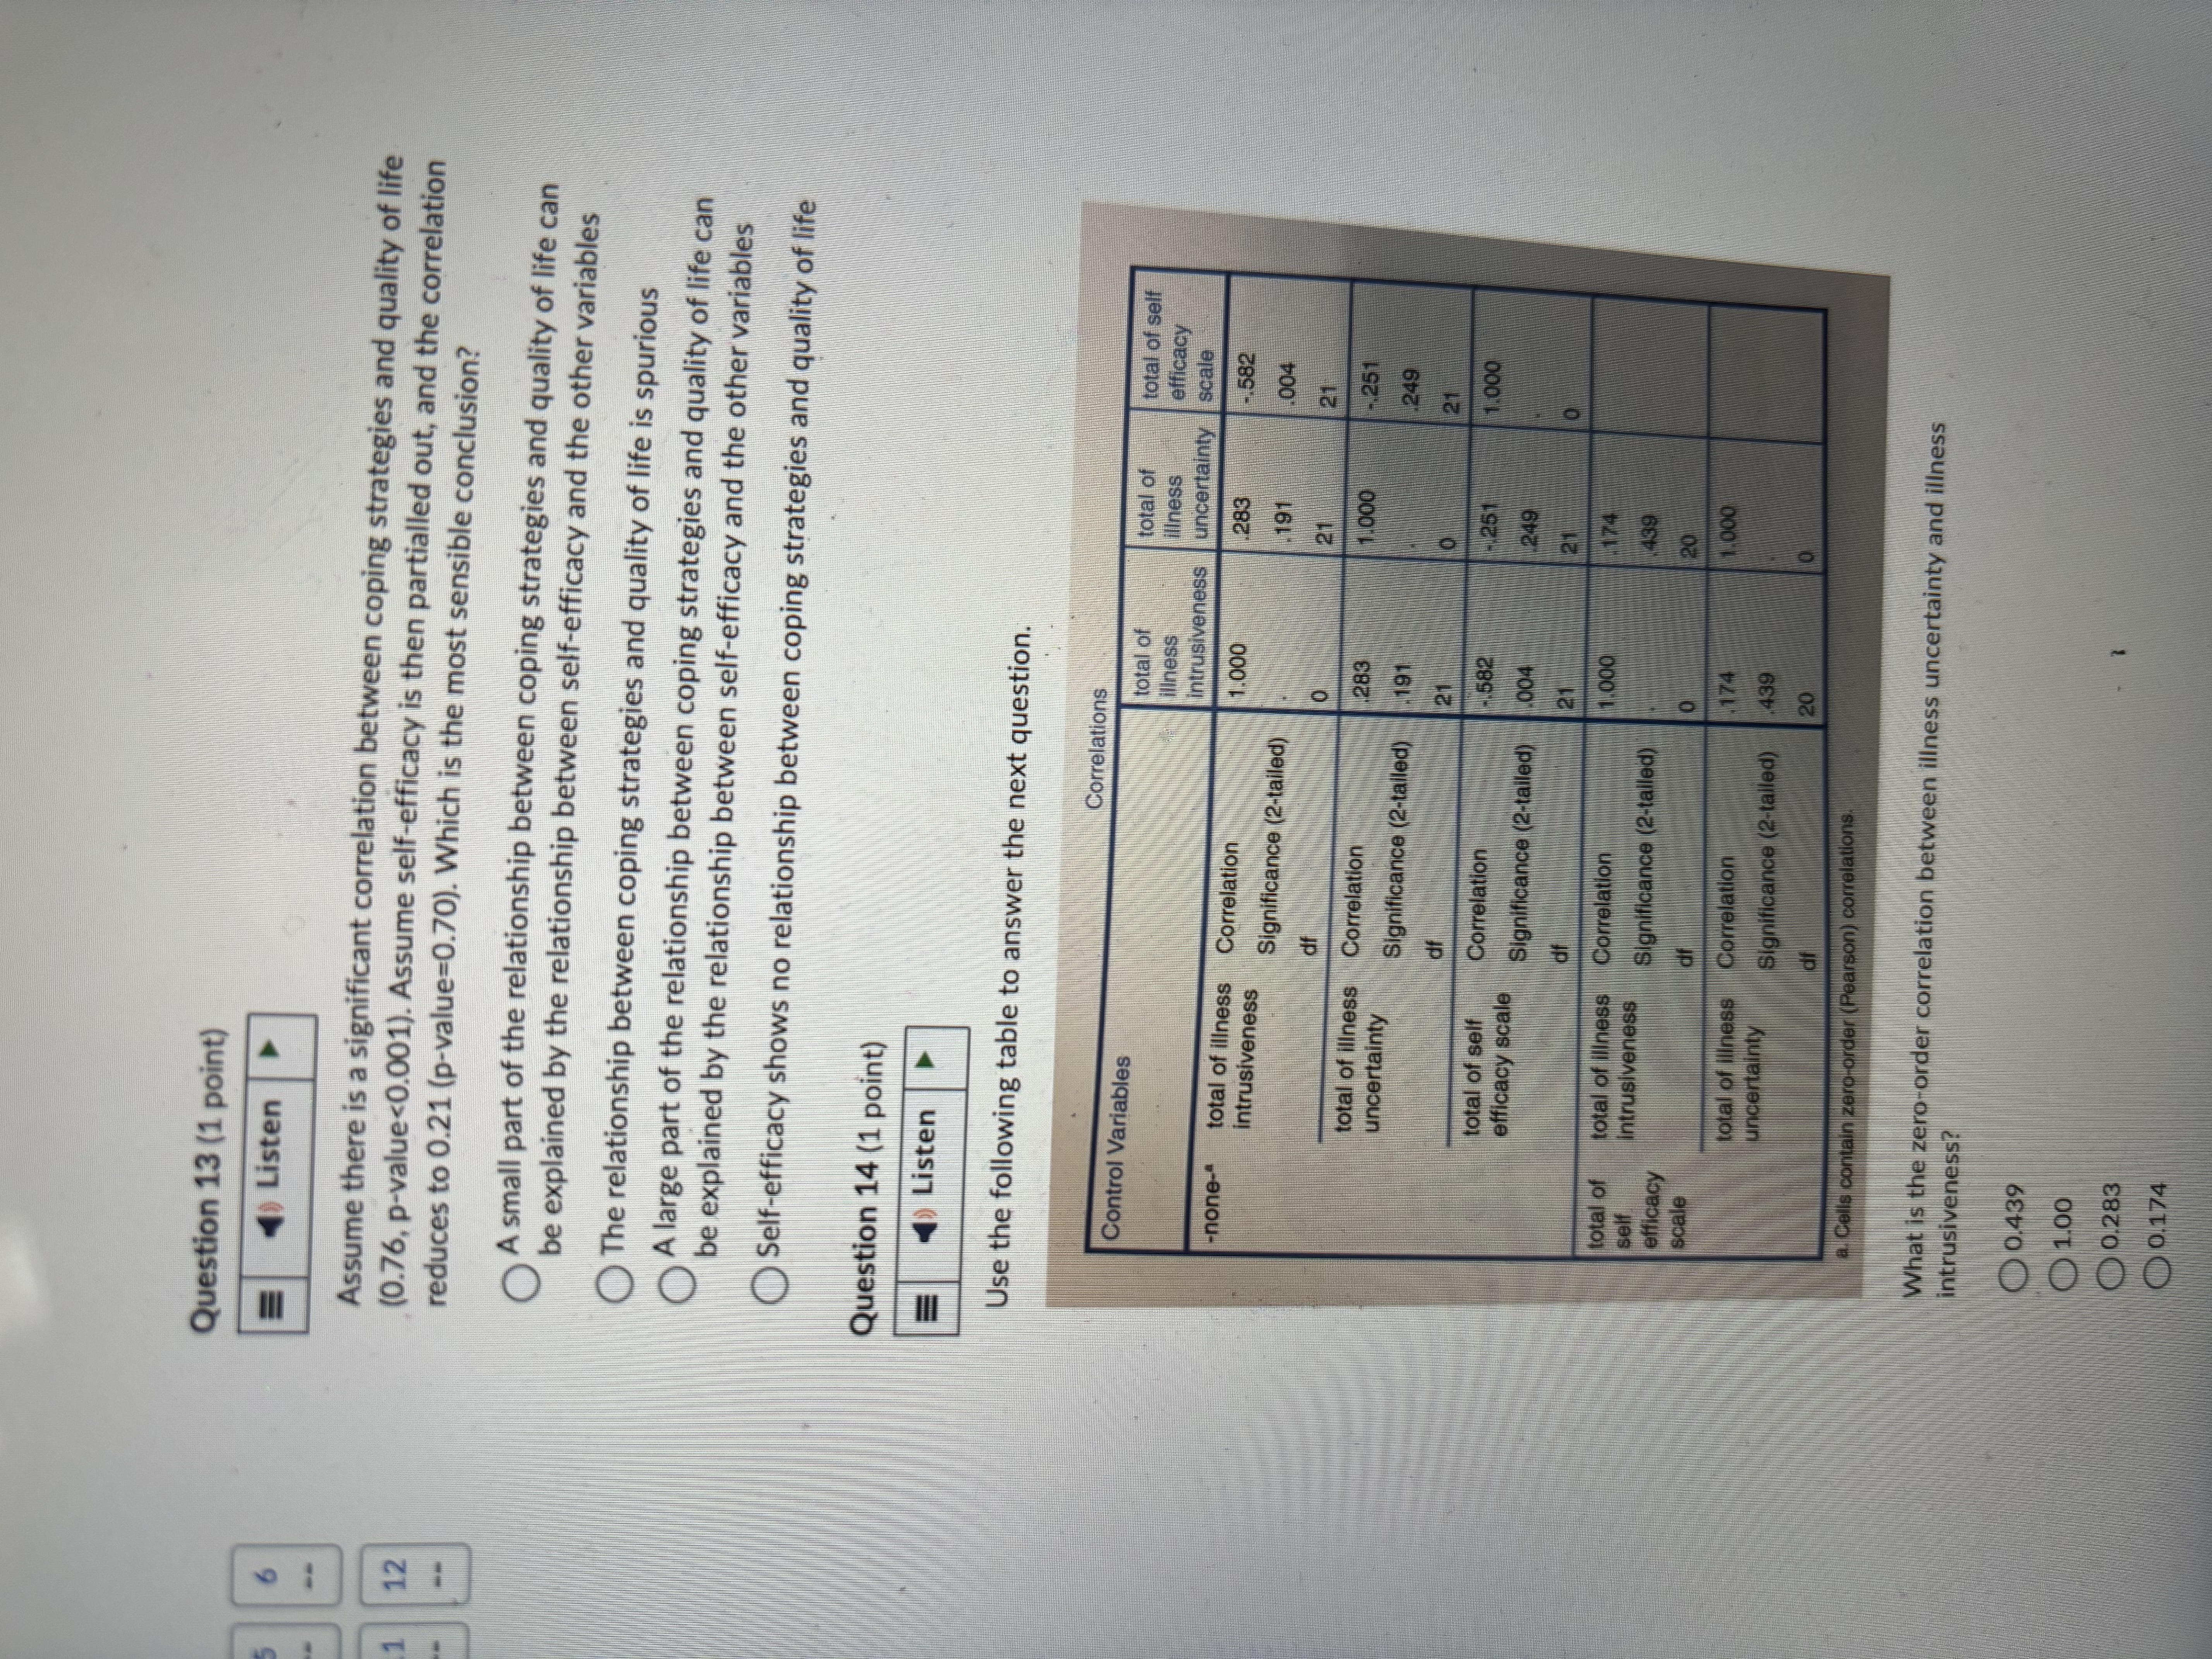
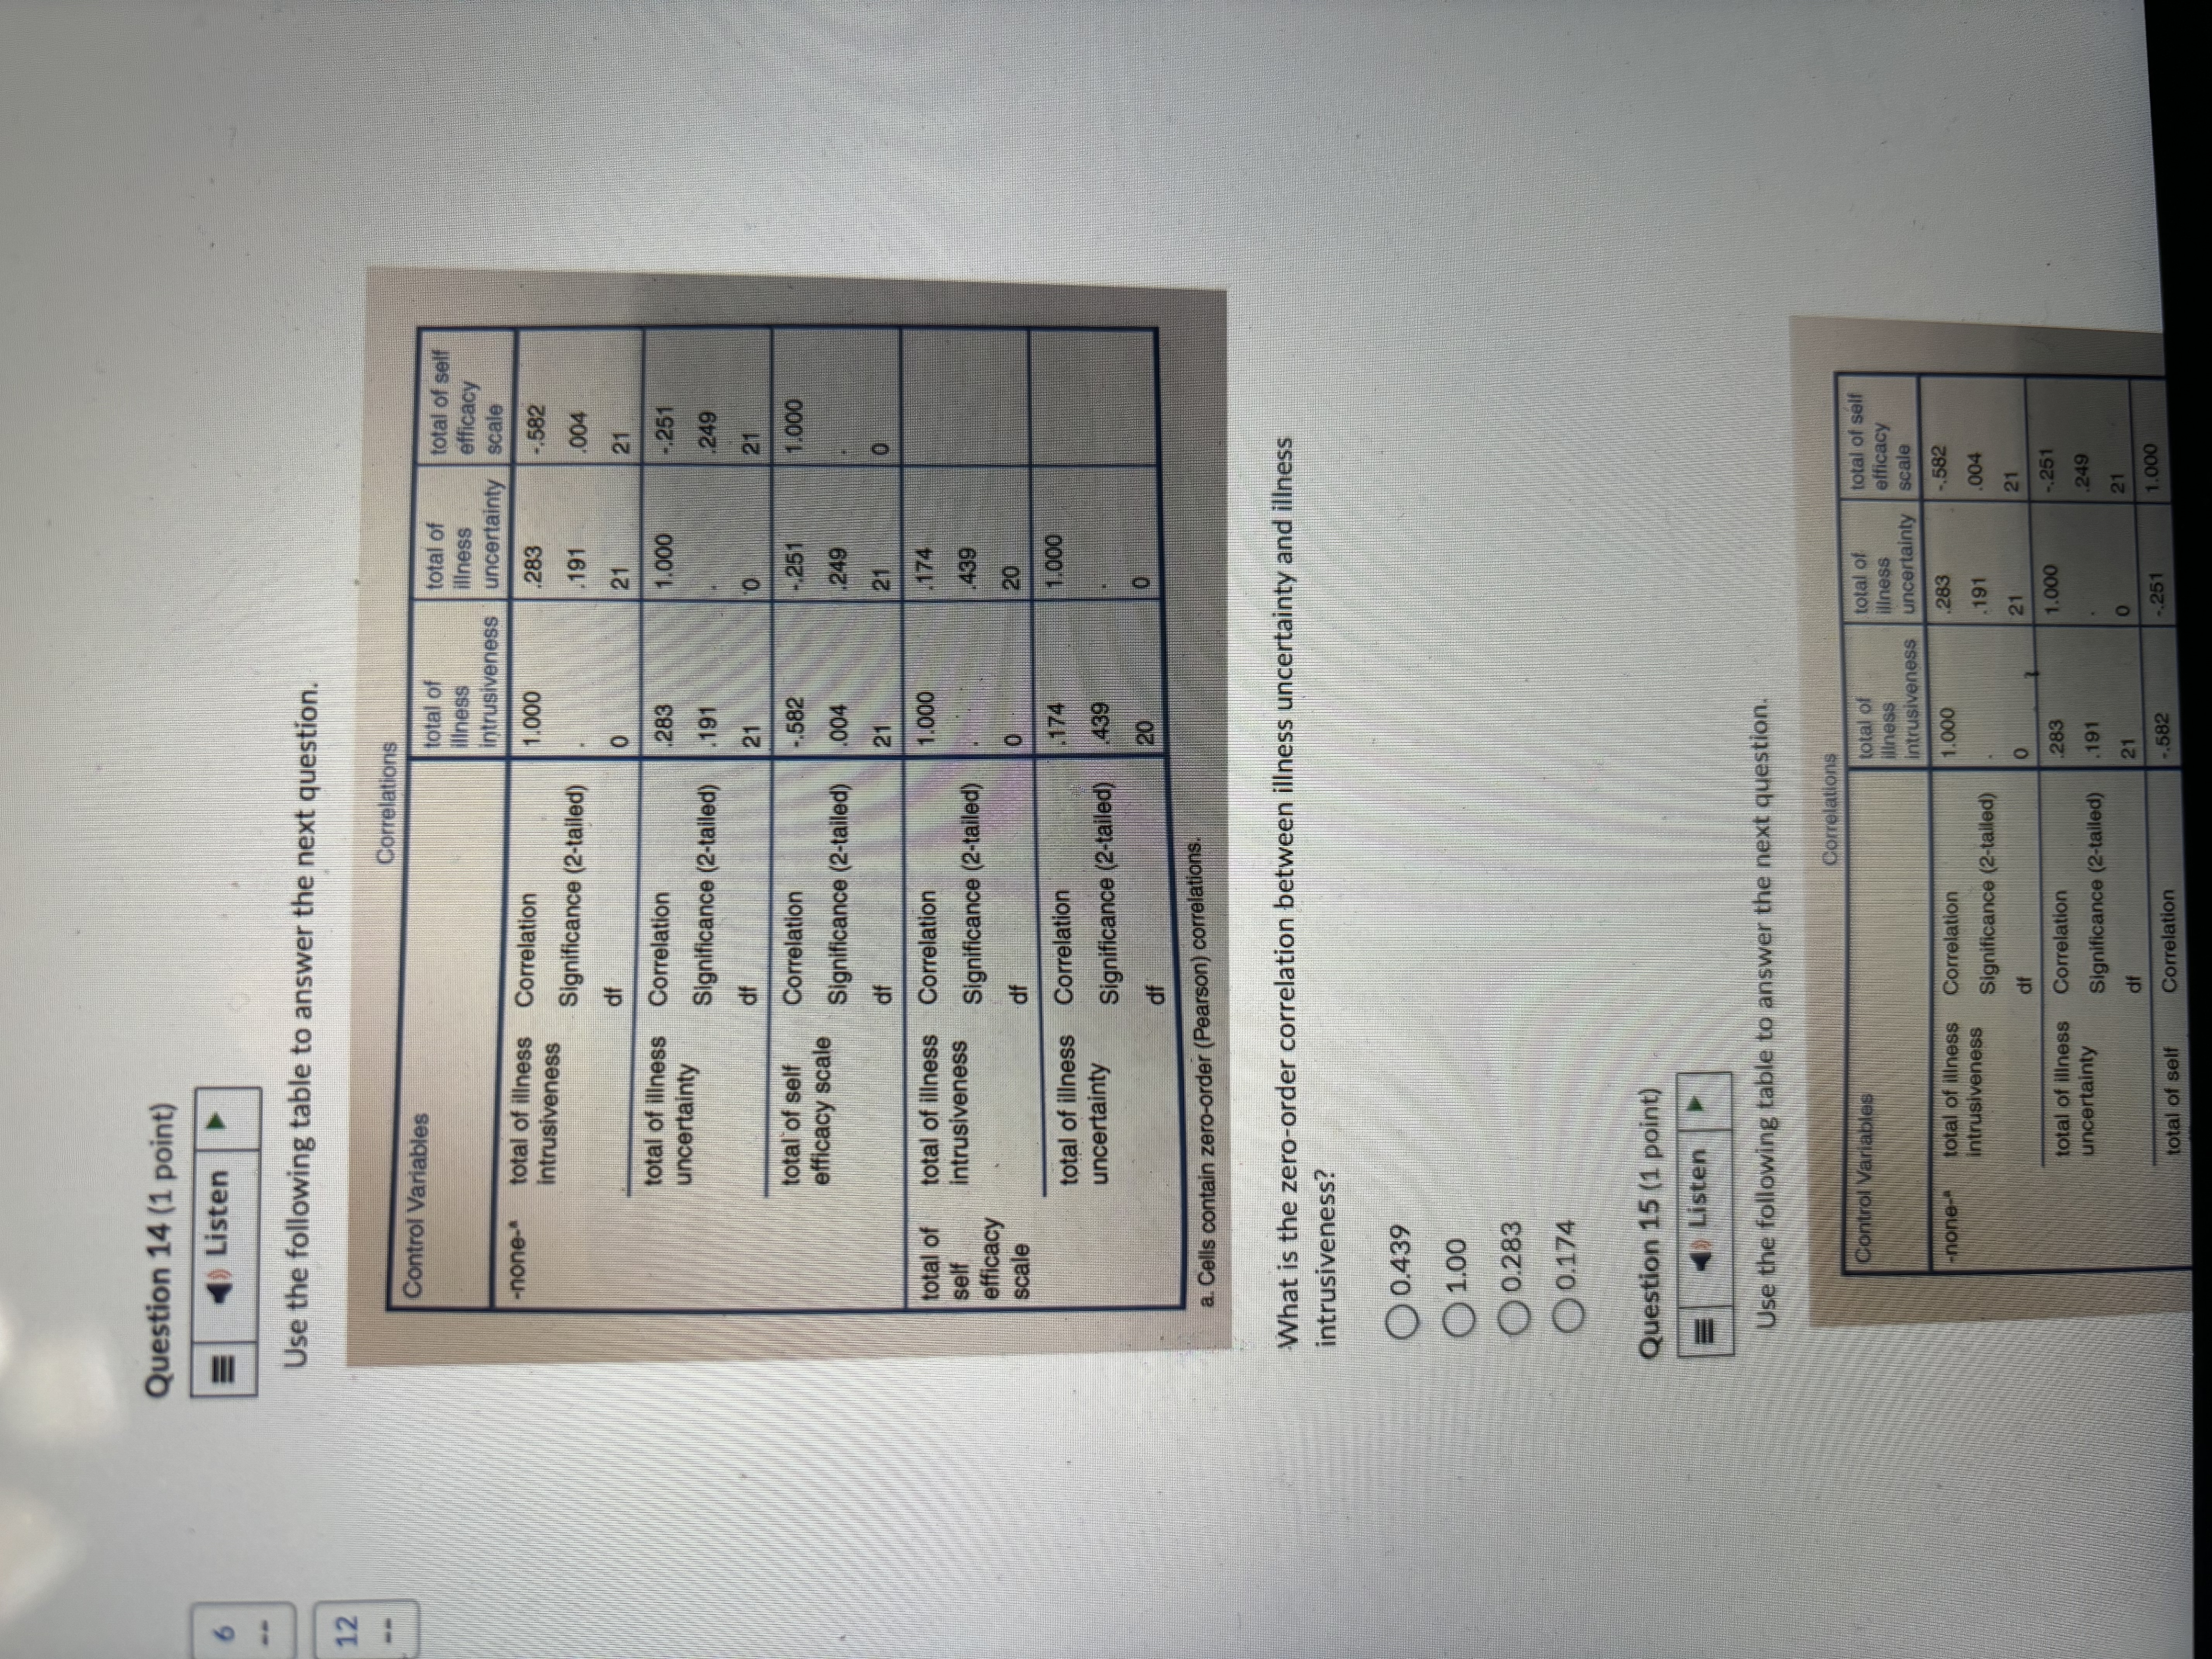
Account Activity State University 0:04:08 elapsed X Question 1 (1 point) Listen 10/00 5.00 4.00 6.00 8.00 10.00 Level of obesity Look at the scatterplot. What is the most sensible conclusion? The relationship is: Zero Positive Non-linear Negative Question 2 (1 point) Saved Listen If you wish to test the relationship between coping and quality of life, with depression controlled for (co-varied out), you would use: Cronbach's alpha Partial correlation O Bivariate corre0:04:19 elapsed X Question 4 (1 point) Listen Ia Explanatory Systolic blood pressure (SBP) Diastolic blood pressure (DBP) 12 variable Boys Girls Tota Boys Girls Total (n=250) (n=250) (N=500) (n=250 (n=250) (N=500) Weight 0.32* 0.41* 0.34 0.33 0.30 Listen Height 0.35 0.33* 0.32 0.24* 0.22 Age 0.32' 0.06* 0.24* 0.03 0.05 0.03 " Significant at the 1% level "Significant at the 5% level Which is the strongest correlation from the following DBP variable? Boys DBP and weight Girls DBP and weight Girls DBP and height Boys DBP and height Question 5 (1 point) Listen Explanatory Systolic blood pressure (SBP) variable Diastolic blood pressure (DEX Boys Girls Total Boys Girls (n=250) Total (n=250 N=500 (n=250) (n=250) (N-500) Weight 0.32 0.41 0.34 0.27 0.33* 0.30* Height 0.35 0.33 0.32" 0.19" 0.24' 0.22 Age 0.32 0.06 0.24- 0.03 0.05 0.03 " Significant at the 1% level ""Significant at the 5% level Which is the weakest correlation from the following SBP variable? Boys SBP and height Boys SBP and weight Girls SBP and weight Girls SBP and age Question 6 (1 pointhis y increases, y decreases. This is an example of a ONon-linear relationship Negative relationship Positive relationship OZero relationship Question 7 (1 point) ) Listen Look at the scatterplot. This is an example of a: 4.00 2.00 Quality of life O -2.00 -4.00 6.00 2.00 4.00 6.00 8.00 10.00 Level of obesity Negative relationship Positive relationship Non-linear relationship Zero relationship Question 8 (1 point) Listen As x increases, y increases. This is an example of a: Non-linear relationship Positive relationshipHe y increases, y incre alle of a Non-linear relationship Positive relationship Zero relationship Negative relationship Question 9 (1 point) ) Listen The table, taken from Baumhover and Hughes (2009), whose objective was to investigate the association between spirituality of health workers and their support for family presence during invasive procedures and resuscitative effort in adults. Correlation between study variables study verisbles Spirituality and the support for family nce during 0.24 05 port for family presence during -0.27 101 Busch Spirituality ence is a patient right" 0.33 101 Viewing ant and family right" 0.52 01 Spirituality 0.32 01 Spirituality ding holistic care" .28 >.05 * providing holistic care" 0.3 01 Which group had the strongest correlation between spirituality and the belief of providing holistic care? Nurses Physicians' assistants Physicians O All groups combined Question 10 (1 point) Listen The table, taken from Baumhover and Hughes (2009), whose objective was to investigate the association between spirituality of health workers and their support for family presence during invasive procedures and resuscitative effort in adults. Correlation between study v Study variablesQuestion 10 (1 point) () Listen The table, taken from Baumhover and Hughes (2009), whose objective was to investigate the association between spirituality of health workers and their support for family presence during invasive procedures and resuscitative effort in adults. Correlation between study variables Study variables Spirituality and the support for family presence during 0.24 05 resuscitative efforts* Health care professional's age and the support for family presence during -0.27 01 resuscitative efforts" Spirituality and the belief that family presence is a patient right* 0.33 101 Viewing family presence as both a patient and family right" 0.52 01 Spirituality and the belief of providing holistic care* 0.32 01 Spirituality and the belief of providing holistic care* 0.28 >.05 Spirituality and the belief of providing holistic care" 0.31 01 " All participants Physicians and physician a "Nurses Look at the relationship between the health care professional's age and support for family presence during resuscitative efforts. The association means that the higher the age of the health care professional, the: Less support for family presence; this is statistically significant More support for family presence; this is statistically significant More support for family presence; this is not statistically significant Less support for family presence; this is not statistically significant Question 11 (1 point) ) Listen The table, taken from Baumhover and Hughes (2009), whose objective was to investigate the association between spirituality of health workers and their support for family presence during invasive procedures and resuscitative effort in adults. Correlation between study variable Study variables Spirituality and the support for fa 0.240:04:53 elapsed X Question 11 (1 point) ) Listen The table, taken from Baumhover and Hughes (2009), whose objective was to investigate the association between spirituality of health workers and their support for family presence during invasive procedures and resuscitative effort in adults. Correlation bet Study variable tipirituality and the support for family preserve during 0.24 resusciative and the support for family presence during -0.27 Spirituality atlent right 0.33 01 Viewin it and family right 101 0.32 01 0.28 .05 0.31 01 Which of the following correlations is not statistically significant at any acceptable level of significance? Spirituality and the belief of providing holistic care (physicians and physicians assistants) Viewing family presence as both a patient and family right Spirituality and the belief of providing holistic care (nurses) Spirituality and the support for family presence during resuscitative efforts Question 12 (1 point) Listen If, in a scatterplot, the datapoints are spread randomly, then the most likely correlation coefficient is:Question 13 (1 point) 6 ) Listen Assume there is a significant correlation between coping strategies and quality of life 12 (0.76, p-value
Step by Step Solution
There are 3 Steps involved in it
Step: 1
Get Instant Access to Expert-Tailored Solutions
See step-by-step solutions with expert insights and AI powered tools for academic success
Step: 2
Step: 3
Ace Your Homework with AI
Get the answers you need in no time with our AI-driven, step-by-step assistance