Answered step by step
Verified Expert Solution
Question
1 Approved Answer
Data for the problem listed below: Country 2007_Index 2010_Index 1 24.9 22.2 2 12.1 11.6 3 8.9 11.6 4 19.6 16.5 5 25.5 22.1 6


Data for the problem listed below:
| Country | 2007_Index | 2010_Index |
| 1 | 24.9 | 22.2 |
| 2 | 12.1 | 11.6 |
| 3 | 8.9 | 11.6 |
| 4 | 19.6 | 16.5 |
| 5 | 25.5 | 22.1 |
| 6 | 13.7 | 13.4 |
| 7 | 17.8 | 15.3 |
| 8 | 13.1 | 11.6 |
| 9 | 11.6 | 10.3 |
| 10 | 29.3 | 29.2 |
| 11 | 9.5 | 14.4 |
| 12 | 22.5 | 19.9 |
| 13 | 8.7 | 8.8 |
| 14 | 15.8 | 12.5 |
| 15 | 21.5 | 16.7 |
| 16 | 27.8 | 16.4 |
| 17 | 22.3 | 3.9 |
| 18 | 24.2 | 26.4 |
| 19 | 13.3 | 27.3 |
| 20 | 18.9 | 17.8 |
| 21 | 8.7 | 5.1 |
| 22 | 15.2 | 20.3 |
| 23 | 8.4 | 8.1 |
| 24 | 20.2 | 8.9 |
| 25 | 20.2 | 17.6 |
| 26 | 11.9 | 10.9 |
| 27 | 11.8 | 12.8 |
| 28 | 16.1 | 12.4 |
| 29 | 22.1 | 16.1 |
| 30 | 22.2 | 20.7 |
| 31 | 6.1 | 5.5 |
| 32 | 9.1 | 8.5 |
| 33 | 12.5 | 13.2 |
| 34 | 21.9 | 17.4 |
| 35 | 20.2 | 20.3 |
| 36 | 18.9 | 15.1 |
| 37 | 38.4 | 35.9 |
| 38 | 13.9 | 13.3 |
| 39 | 21.3 | 25.9 |
| 40 | 22.9 | 19.9 |
| 41 | 22.8 | 20.1 |
| 42 | 33.9 | 30.8 |
| 43 | 11.3 | 10.1 |
| 44 | 18.7 | 17.6 |
| 45 | 21.2 | 20.2 |
| 46 | 17.4 | 15.5 |
| 47 | 7.4 | 8.5 |
| 48 | 5.9 | 5.1 |
| 49 | 65.3 | 63.7 |
| 50 | 20.6 | 19.6 |
| 51 | 11.9 | 13.8 |
| 52 | 13.1 | 12.4 |
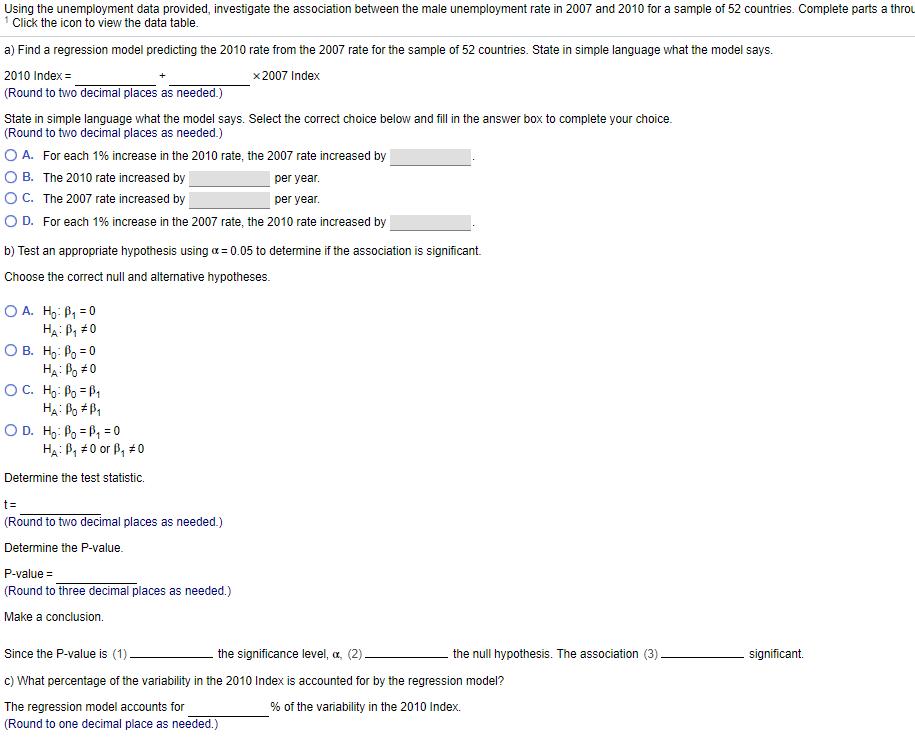
Using the unemployment data provided, investigate the association between the male unemployment rate in 2007 and 2010 for a sample of 52 countries. Complete parts a throu 1 Click the icon to view the data table. a) Find a regression model predicting the 2010 rate from the 2007 rate for the sample of 52 countries. State in simple language what the model says. 2010 Index = x 2007 Index (Round to two decimal places as needed.) State in simple language what the model says. Select the correct choice below and fill in the answer box to complete your choice. (Round to two decimal places as needed.) O A. For each 1% increase in the 2010 rate, the 2007 rate increased by OB. The 2010 rate increased by per year. per year. O C. The 2007 rate increased by O D. For each 1% increase in the 2007 rate, the 2010 rate increased by b) Test an appropriate hypothesis using = 0.05 to determine if the association is significant. Choose the correct null and alternative hypotheses. OA. Ho: B = 0 HA: B #0 OB. Ho: P = 0 HA: Po #0 H. Bo = Bi HA: BO #B C OD. Ho: Po=B = 0 HA: B #0 or B #0 Determine the test statistic. t= (Round to two decimal places as needed.) Determine the P-value. P-value= (Round to three decimal places as needed.) Make a conclusion. the null hypothesis. The association (3). Since the P-value is (1). the significance level, a, (2) c) What percentage of the variability in the 2010 Index is accounted for by the regression model? The regression model accounts for % of the variability in the 2010 Index. (Round to one decimal place as needed.) significant.
Step by Step Solution
★★★★★
3.45 Rating (164 Votes )
There are 3 Steps involved in it
Step: 1
Answer a 2010index06941087892007index D for each 1 incerease in 2007 index the 2010 r...
Get Instant Access to Expert-Tailored Solutions
See step-by-step solutions with expert insights and AI powered tools for academic success
Step: 2

Step: 3

Ace Your Homework with AI
Get the answers you need in no time with our AI-driven, step-by-step assistance
Get Started


