Question
1. Common size statement analysis a. Prepare a common-size cash flow statement for 2014 using net sales as the common size and keep 2 decimal
1. Common size statement analysis
a. Prepare a common-size cash flow statement for 2014 using net sales as the common size and keep 2 decimal places in the percentage, (for example, 12.43%).
b. Are depreciation expenses and capital expenditure significant components in the cash flow statement percentage-wise? Is that surprising?
c. Percentage-wise is operating cash flow/net sales higher than net income/sales?? Is that good?
d. Do operating cash flows meet the needs of investment and distribution? Provide your comment(s) on the trend of the answer to this question?

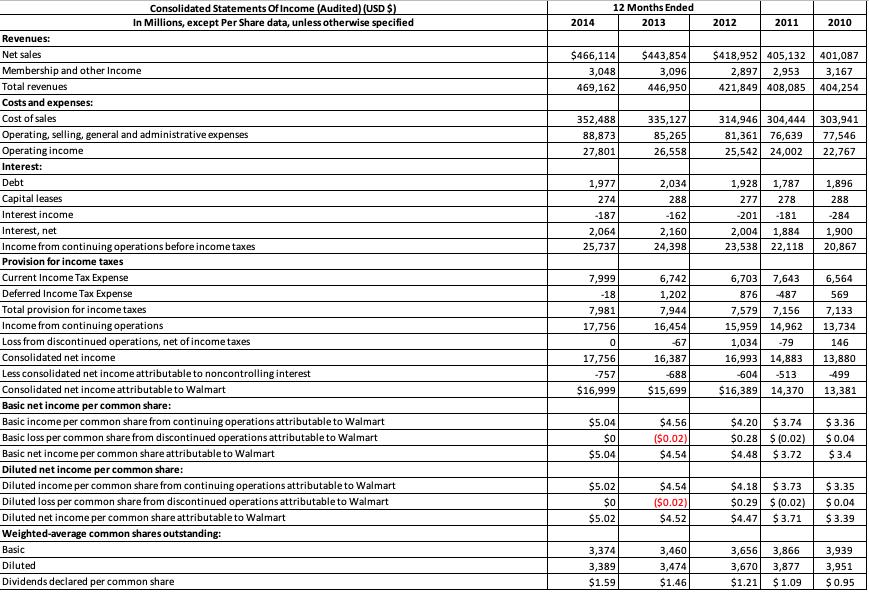
Consolidated Statements Of Income (Audited) (USD $) In Millions, except Per Share data, unless otherwise specified 12 Months Ended 2014 2013 2012 2011 2010 Revenues: Net sales $466,114 $443,854 $418,952 405,132 401,087 Membership and other Income 3,048 3,096 2,897 421,849 408,085 2,953 3,167 Total revenues 469,162 446,950 404,254 Costs and expenses: Cost of sales 314,946 304,444 81,361 76,639 25,542 24,002 352,488 335,127 303,941 77,546 Operating, selling, general and administrative expenses 88,873 85,265 Operating income 27,801 26,558 22,767 Interest: Debt 1,977 2,034 1,928 1,787 1,896 Capital leases 274 288 277 278 288 Interest income -187 -162 -201 -181 -284 Interest, net 2,064 2,160 2,004 1,884 1,900 Income from continuing operations before income taxes 25,737 24,398 23,538 22,118 20,867 Provision for income taxes Current Income Tax Expense 7,999 6,742 6,703 7,643 6,564 Deferred Income Tax Expense -18 876 1,202 7,944 -487 569 Total provision for income taxes 7,981 7,579 7,156 7,133 Income from continuing operations 17,756 16,454 15,959 14,962 13,734 Loss from discontinued operations, net of incometaxes 67 1,034 -79 146 Consolidated net income 17,756 16,387 16,993 14,883 13,880 Less consolidated net income attributable to noncontrolling interest -757 -688 -604 -513 -499 Consolidated net income attributable to Walmart $16,999 $15,699 $16,389 14,370 13,381 Basic net income per common share: $ 3.74 $0.28 $ (0.02) Basic income per common share from continuing operations attributable to Walmart $5.04 $4.56 $4.20 $ 3.36 Basic loss per common share from discontinued operations attributable to Walmart $0 ($0.02) $0.04 Basic net income per common share attributable to Walmart $5.04 $4.54 $4.48 $3.72 $ 3.4 Diluted net income per common share: $ 3.73 $0.29 $ (0.02) $ 3.71 Diluted income per common share from continuing operations attributable to Walmart $5.02 $4.54 $4.18 $ 3.35 Diluted loss per common share from discontinued operations attributable to Walmart $0 ($0.02) $0.04 Diluted net income per common share attributable to Walmart $5.02 $4.52 $4.47 $ 3.39 Weighted-average common shares outstanding: Basic 3,374 3,460 3,656 3,866 3,939 Diluted 3,389 3,474 3,670 3,877 3,951 Dividends declared per common share $1.59 $1.46 $1.21 $1.09 $0.95
Step by Step Solution
3.43 Rating (150 Votes )
There are 3 Steps involved in it
Step: 1
a CASH FLOW RATIO BALANCE SHEET Income statement b Depreciation Ex...
Get Instant Access to Expert-Tailored Solutions
See step-by-step solutions with expert insights and AI powered tools for academic success
Step: 2

Step: 3

Ace Your Homework with AI
Get the answers you need in no time with our AI-driven, step-by-step assistance
Get Started


