Answered step by step
Verified Expert Solution
Question
1 Approved Answer
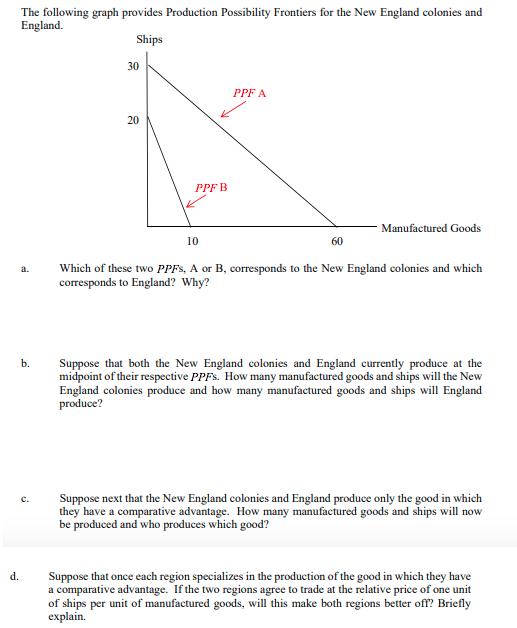
The following graph provides Production Possibility Frontiers for the New England colonies and England. Ships 30 PPF A 20 PPF B Manufactured Goods 10

The following graph provides Production Possibility Frontiers for the New England colonies and England. Ships 30 PPF A 20 PPF B Manufactured Goods 10 60 Which of these two PPFS, A or B, corresponds to the New England colonies and which corresponds to England? Why? a. b. Suppose that both the New England colonies and England currently produce at the midpoint of their respective PPFS. How many manufactured goods and ships will the New England colonies produce and how many manufactured goods and ships will England produce? Suppose next that the New England colonies and England produce only the good in which they have a comparative advantage. How many manufactured goods and ships will now be produced and who produces which good? c. Suppose that once each region specializes in the production of the good in which they have a comparative advantage. If the two regions agree to trade at the relative price of one unit of ships per unit of manufactured goods, will this make both regions better off? Briefly explain. d.
Step by Step Solution
★★★★★
3.44 Rating (163 Votes )
There are 3 Steps involved in it
Step: 1
a Since England is likely to have more resources as a nation as compared to New England col...
Get Instant Access to Expert-Tailored Solutions
See step-by-step solutions with expert insights and AI powered tools for academic success
Step: 2

Step: 3

Ace Your Homework with AI
Get the answers you need in no time with our AI-driven, step-by-step assistance
Get Started


