1. When comparing performance during the first five months of 2010 with performance in 2009, which warehouse shows the most improvement? 2. When comparing performance
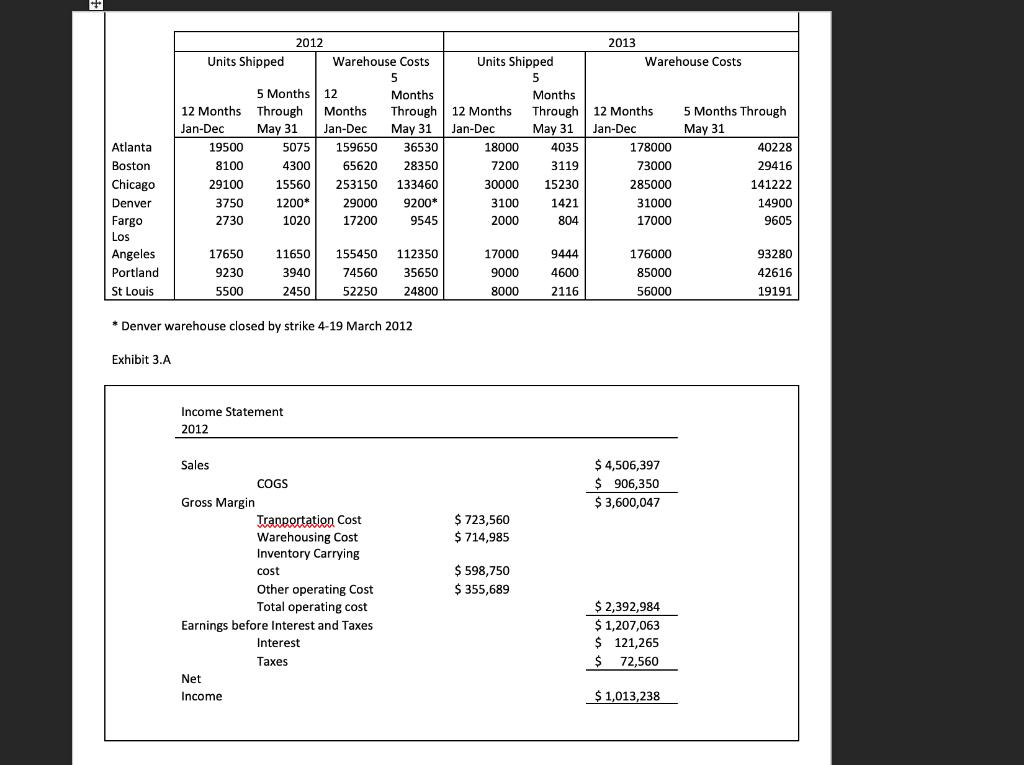
1. When comparing performance during the first five months of 2010 with performance in 2009, which warehouse shows the most improvement?
2. When comparing performance during the first five months of 2010 with performance in 2009, which warehouse shows the poorest change in performance?
3. When comparisons are made among all eight warehouses, which one do you think does the best job for the Brant Company? What criteria did you use? Why?
4. J.Q. is aggressive and is going to recommend that his father cancel the contract with one of the warehouses and give that business to a competing warehouse in the same city. J.Q. feels that when word gets around, the other warehouses they use will %u201Cshape up.%u201D Which of the seven should J.Q. recommend be dropped? Why?
5. The year 2010 is nearly half over. J.Q. is told to determine how much the firm is likely to spend for warehousing at each of the eight warehouses for the last six months in 2010. Do his work for him.
6. When comparing the 2009 figures with the 2010 figures shown in the tables, the amount budgeted for each warehouse in 2010 was greater than the actual 2009 costs. How much of the increase is caused be increased volume of business (units shipped) and how much by inflation?
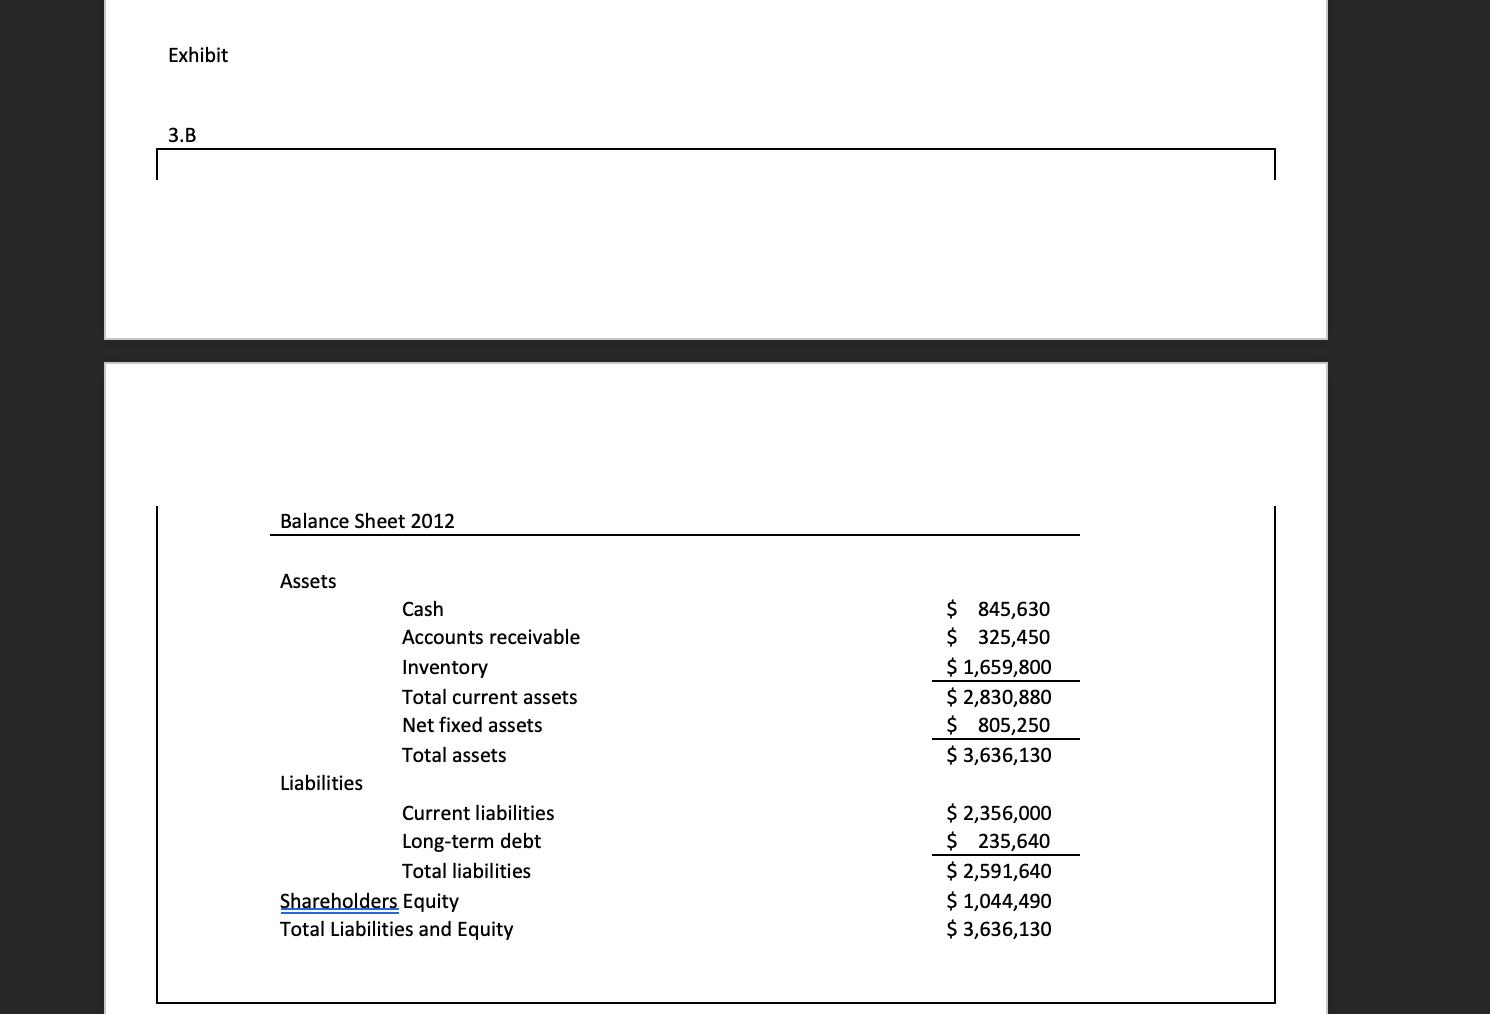
7. Use the 2009 income statement and balance sheet to complete a Strategic Profit for J.Q.
8. Holding all other information constant, what would be the effect on ROA for 2010 if warehousing costs declined 10 percent from 2009 levels?


2012 2013 Units Shipped Warehouse Costs Units Shipped Warehouse Costs 5 5 5 Months 12 12 Months Through Months Months Months Through 12 Months Through 12 Months May 31 5 Months Through May 31 May 31 Jan-Dec Jan-Dec Jan-Dec Jan-Dec May 31 Atlanta 19500 5075 159650 36530 18000 4035 178000 40228 Boston 8100 4300 65620 28350 7200 3119 73000 29416 Chicago 29100 15560 253150 133460 30000 15230 285000 141222 Denver 3750 1200* 29000 9200* 3100 1421 31000 14900 Fargo 2730 1020 17200 9545 2000 804 17000 9605 Los Angeles 17650 11650 155450 112350 17000 9444 176000 93280 Portland 9230 3940 74560 35650 9000 4600 85000 42616 St Louis 52250 56000 5500 2450 24800 8000 2116 19191 * Denver warehouse closed by strike 4-19 March 2012 Exhibit 3.A Income Statement 2012 $ 4,506,397 $ 906,350 $ 3,600,047 Sales COGS Gross Margin Tranportation Cost Warehousing Cost Inventory Carrying $ 723,560 $ 714,985 $ 598,750 $ 355,689 cost Other operating Cost Total operating cost $ 2,392,984 $ 1.,207.063 $ 121,265 $ 72,560 Earnings before Interest and Taxes Interest es Net Income $ 1,013,238
Step by Step Solution
3.44 Rating (154 Votes )
There are 3 Steps involved in it
Step: 1
After calculated all of the warehouse costs per unit of ...
See step-by-step solutions with expert insights and AI powered tools for academic success
Step: 2

Step: 3

Ace Your Homework with AI
Get the answers you need in no time with our AI-driven, step-by-step assistance
Get Started


