Accounting Audit
Please help me discuss the summaries of the sales in the two years 2015 and 2016

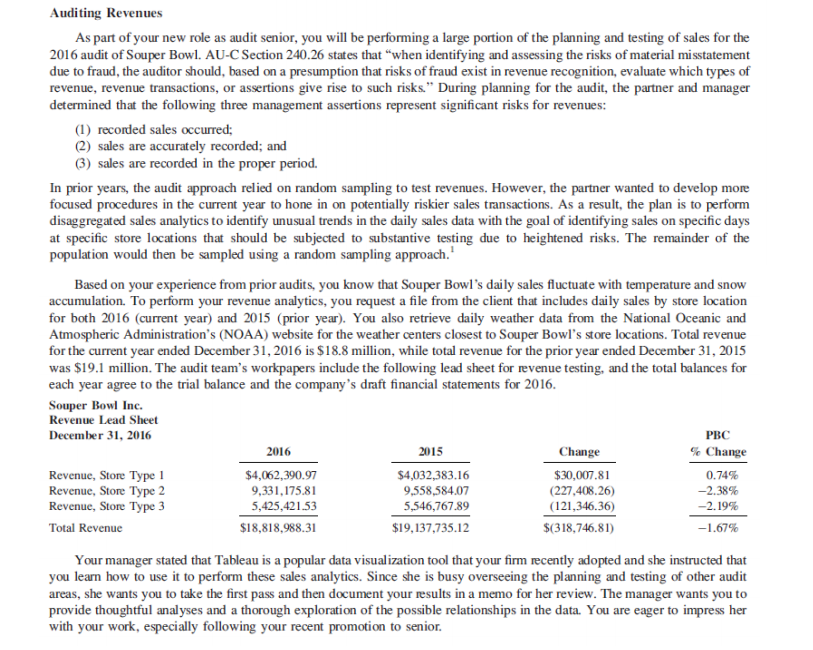
Auditing Revenues As part of your new role as audit senior, you will be performing a large portion of the planning and testing of sales for the 2016 audit of Souper Bowl. AU-C Section 240.26 states that "when identifying and assessing the risks of material misstatement due to fraud, the auditor should, based on a presumption that risks of fraud exist in revenue recognition, evaluate which types of revenue, revenue transactions, or assertions give rise to such risks." During planning for the audit, the partner and manager determined that the following three management assertions represent significant risks for revenues: (1) recorded sales occurred; (2) sales are accurately recorded; and (3) sales are recorded in the proper period. In prior years, the audit approach relied on random sampling to test revenues. However, the partner wanted to develop more focused procedures in the current year to hone in on potentially riskier sales transactions. As a result, the plan is to perform disaggregated sales analytics to identify unusual trends in the daily sales data with the goal of identifying sales on specific days at specific store locations that should be subjected to substantive testing due to heightened risks. The remainder of the population would then be sampled using a random sampling approach. Based on your experience from prior audits, you know that Souper Bowl's daily sales fluctuate with temperature and snow accumulation. To perform your revenue analytics, you request a file from the client that includes daily sales by store location for both 2016 (current year) and 2015 (prior year). You also retrieve daily weather data from the National Oceanic and Atmospheric Administration's (NOAA) website for the weather centers closest to Souper Bowl's store locations. Total revenue for the current year ended December 31, 2016 is $18.8 million, while total revenue for the prior year ended December 31, 2015 was $19.1 million. The audit team's workpapers include the following lead sheet for revenue testing, and the total balances for each year agree to the trial balance and the company's draft financial statements for 2016. Souper Bowl Inc. Revenue Lead Sheet December 31, 2016 PBC 2016 2015 Change % Change Revenue, Store Type 1 $4,062,390.97 $4,032,383.16 $30,007.81 0.74% Revenue, Store Type 2 9,331,175.81 9,558,584.07 (227,408.26) -2.38% Revenue, Store Type 3 5,425,421.53 5,546,767.89 (121,346.36) -2.19% Total Revenue $18,818,988.31 $19, 137,735.12 $(318,746.81) -1.67% Your manager stated that Tableau is a popular data visualization tool that your firm recently adopted and she instructed that you learn how to use it to perform these sales analytics. Since she is busy overseeing the planning and testing of other audit areas, she wants you to take the first pass and then document your results in a memo for her review. The manager wants you to provide thoughtful analyses and a thorough exploration of the possible relationships in the data. You are eager to impress her with your work, especially following your recent promotion to senior. Auditing Revenues As part of your new role as audit senior, you will be performing a large portion of the planning and testing of sales for the 2016 audit of Souper Bowl. AU-C Section 240.26 states that "when identifying and assessing the risks of material misstatement due to fraud, the auditor should, based on a presumption that risks of fraud exist in revenue recognition, evaluate which types of revenue, revenue transactions, or assertions give rise to such risks." During planning for the audit, the partner and manager determined that the following three management assertions represent significant risks for revenues: (1) recorded sales occurred; (2) sales are accurately recorded; and (3) sales are recorded in the proper period. In prior years, the audit approach relied on random sampling to test revenues. However, the partner wanted to develop more focused procedures in the current year to hone in on potentially riskier sales transactions. As a result, the plan is to perform disaggregated sales analytics to identify unusual trends in the daily sales data with the goal of identifying sales on specific days at specific store locations that should be subjected to substantive testing due to heightened risks. The remainder of the population would then be sampled using a random sampling approach. Based on your experience from prior audits, you know that Souper Bowl's daily sales fluctuate with temperature and snow accumulation. To perform your revenue analytics, you request a file from the client that includes daily sales by store location for both 2016 (current year) and 2015 (prior year). You also retrieve daily weather data from the National Oceanic and Atmospheric Administration's (NOAA) website for the weather centers closest to Souper Bowl's store locations. Total revenue for the current year ended December 31, 2016 is $18.8 million, while total revenue for the prior year ended December 31, 2015 was $19.1 million. The audit team's workpapers include the following lead sheet for revenue testing, and the total balances for each year agree to the trial balance and the company's draft financial statements for 2016. Souper Bowl Inc. Revenue Lead Sheet December 31, 2016 PBC 2016 2015 Change % Change Revenue, Store Type 1 $4,062,390.97 $4,032,383.16 $30,007.81 0.74% Revenue, Store Type 2 9,331,175.81 9,558,584.07 (227,408.26) -2.38% Revenue, Store Type 3 5,425,421.53 5,546,767.89 (121,346.36) -2.19% Total Revenue $18,818,988.31 $19, 137,735.12 $(318,746.81) -1.67% Your manager stated that Tableau is a popular data visualization tool that your firm recently adopted and she instructed that you learn how to use it to perform these sales analytics. Since she is busy overseeing the planning and testing of other audit areas, she wants you to take the first pass and then document your results in a memo for her review. The manager wants you to provide thoughtful analyses and a thorough exploration of the possible relationships in the data. You are eager to impress her with your work, especially following your recent promotion to senior


